

Introduction
물은 작물생육과 농업생산에 필요한 핵심 요소이며, 물부족은 농업생산성을 감소시키고 식량안보를 위협한다 (Hanjra and Qureshi, 2010). 토양수분은 토양 중 양분을 용해하는 중요한 용매제로서 모세관 현상, 능동수송, 수분포텐셜 등 물 흡수기작에 의해 작물에 흡수되고 (Tinker and Nye, 2000), 토양과 작물을 매체로 하여 토양수분의 증발 (evaporation)과 증산 (transpiration) 작용이 일어나게 된다 (Hillel, 1971; Scott, 2000). 증발산 (evapotranspiration)은 농업환경에서 수분의 1차 소비원이며 식생, 기상, 기후 등의 영향을 받는 가변인자이다 (Allen et al., 2011a; Allen et al., 2011b). 1994년 이후 식생인자가 포함된 기준 증발산 (reference evapotranspiration) 용어가 사용되었고 (Allen et al., 1994), 특히 기준 작물증발산 (reference crop evapotranspiration)은 충분한 수분 공급 조건에서 생육하는 잔디 등 기준작물의 증산과 토양표면의 증발을 합산한 개념이다 (Allen et al., 1998). 기준 증발산량 산정은 기상자료를 이용한 산정공식이 적용되며 (Hargreaves and Samani, 1985; Allen et al., 1998), 세계적으로 FAO Penman-Monteith (FAO PM) 공식 (Allen et al., 1998), Hargreaves 공식 (Hargreaves and Samani, 1985) 등이 사용되고 있다. FAO PM 공식은 국내외적으로 활용도가 높고, Jensen et al. (1990), Cai et al. (2007)와 Pereira et al. (2015)의 연구에서 FAO PM 공식의 우수성이 검증된 바 있으며, 국내에서도 다양한 조건에서 FAO PM 공식을 활용한 기준 증발산량 추세분석 및 추정 연구가 보고된 바 있다 (Rim, 2008; Lee and Cho, 2011). Hargreaves 공식은 비교적 적은 기상자료를 활용하여 기준 증발산량을 산정할 수 있는 장점이 있다 (Hargreaves and Samani, 1985). 하지만 이들 공식은 기상자료가 제공되는 해당지역에서만 사용가능하며 (Yoon and Choi, 2018), 기상자료가 제공되는 지점과 조사하고자 하는 지점의 토양환경 조건이 동일하지 않기 때문에 특정 토양환경에 적용하는데 한계가 있다. 최근에는 토양 중 수분이동의 정밀한 측정을 위하여 자연토양 구조 그대로를 이용한 중량식 라이시미터 연구가 확대되고 있다 (Meissner et al., 2010; Meißner et al., 2010; Anapalli et al., 2016). 그러나 다양한 토양 조건에서 중량식 라이시미터를 이용한 기준 증발산량 산정 연구는 미흡한 실정이며, 라이시미터를 이용하여 산정한 기준 증발산량에 대한 검증이 요구된다. 또한 동절기에는 강수, 기온 등의 영향으로 작물 생육에 불리한 조건이므로 (Wilson et al., 2005; Longobardi, 2008; Hong et al., 2012), 계절별 기준 증발산량에 영향을 줄 수 있다. 물부족과 기후변화 등 농업위기 상황에서 보다 정밀한 기준 증발산량 산정은 효율적인 물관리를 위한 필수사항이라 할 수 있다. 따라서 본 연구에서는 첫째, 서로 다른 토양에서 중량식 라이시미터를 이용한 잔디생육 조건의 기준 증발산량을 조사하고, 둘째, 중량식 라이시미터로 산정된 기준 증발산량과 Hargreaves 공식 및 FAO Penman-Monteith 공식으로 산정된 기준 증발산량 간 상관도를 평가하였으며, 셋째, 월별 기준 증발산량의 상관도를 평가하였다. 본 결과를 바탕으로 라이시미터를 이용하여 산정된 기준 증발산량에 대한 검증과 그 이용 가능성을 논하고자 하였다.
Materials and Methods
연구시설 및 시험토양
본 연구는 중량식 라이시미터 (Weighable lysimeter, UGT, Germany) 시설에서 수행되었으며, 전라북도 완주군 이서면 국립농업과학원 (National Institute of Agricultural Sciences, NIAS; Wanju, WJ)에 위치 (북위 35°49'29", 동경 127°02'46", 해발고도 33 m) 하고 있다. 중량식 라이시미터는 표면적 1.0 m2, 깊이 1.5 m의 원통형으로 자연토양 그대로의 비교란 토양이 충진되어 있다. 라이시미터의 로드셀은 토양무게 변화를 실시간으로 측정하고, 티핑카운터 (tipping counter)는 지하투수량을 측정한다. 데이터는 1시간 단위 평균값으로 data logger (UGTLog, UGT, Germanay)에 저장된다. 시험에 사용된 토양은 식양질 (fine loamy, FL)과 사양질 (coarse loamy, CL) 토양으로서 토양의 물리적 특성은 Table 1에 나타내었다. 깊이별 토양의 물리적 특성은 용적밀도 (bulk density)와 토성 (soil texture)을 조사하였다. 용적밀도는 코아법 (Blake and Hartge, 1986)을 이용하였고, 토성은 비중계법 (Gee and Bauder, 1986)을 이용하여 토양입자분포 (soil particle distribution)를 산정한 후 미국 농무성 (United States Department of Agriculture, USDA)의 토성 삼각표 (soil texture triangle)에 따라 결정하였다. 본 라이시미터 시설과 토양은 Lee et al. (2017)과 Ok et al. (2018)의 연구에 사용된 바 있다.
Table 1. Soil physical properties of profiles used in this study.
잔디 생육 및 기상자료 수집
본 연구에서는 라이시미터의 기준 증발산량 (reference evapotranspiration, ET0) 산정을 위하여 기준작물로서 잔디를 선정하였으며, 잔디는 전세계적으로 보편화된 기준작물이다 ( Allen et al., 1998). 시설 및 잔디 생육의 안정화를 고려하여 2015년 6월 1일부터 2015년 12월 31일까지의 생육기간 동안을 연구기간으로 하였다. 연구지점의 기상자료는 라이시미터 시설에 설치된 기상관측시스템 (Weather Information System, WIS, STA Co., Korea)에서 수집하였다. 연구지점과 인접한 전주 (Jeonju, JJ) 지역의 기준 증발산량 비교를 위하여 기상청의 기상자료개방포털 (KMA, 2019)에서 제공하는 기상자료를 수집하였다. 수집된 기상자료는 연구기간과 동일한 2015년 6월 1일부터 2015년 12월 31일까지이다.
기준 증발산량 산정
기준 증발산량 (reference evapotranspiration, ET0)은 2015년 6월 1일부터 2015년 12월 31일까지의 라이시미터 데이터와 기상자료를 활용하여 산정하였다. 잔디가 식재된 라이시미터의 기준 증발산량은 LYET (reference evapotranspiration calculated by the weighable lysimeter), Hagreaves and Samani (1985)의 Hargreaves 공식에 따른 기준 증발산량은 HSET (reference evapotranspiration calculated by the Hargreaves equation), Allen et al. (1998)의 FAO Penman-Monteith (FAO PM) 공식에 따른 기준 증발산량은 PMET (reference evapotranspiration calculated by the FAO Penman-Monteith equation)로 나타내었다. 라이시미터를 활용한 LYET 산정공식은 (Eq. 1)과 같고, Klammler and Fank (2014)가 제안한 방법이다.
| $$LYET=P+I-D-R$$ | (Eq. 1) |
LYET는 기준 증발산량 (mm day-1), P (precipitation)는 강수량 (mm day-1), I (irrigation)는 관개량 (mm day-1), D (drainage)는 지하유출량 (mm day-1), R (run-off water)은 지표유거량 (mm day-1)을 나타낸다.
HSET 산정공식은 (Eq. 2)와 같고, Hagreaves and Samani (1985)가 제안한 Hargreaves 공식이다.
| $$HSET=K_{ET}R_ATD^{0.05}(T+17.8)$$ | (Eq. 2) |
HSET는 기준 증발산량 (mm day-1), KET는 Hargreaves and Samani (1985)가 미국 캘리포니아주 데이비스 (Davis) 도시의 8년 기상자료를 토대로 산정한 값 (기본값 0.0023)이다. RA는 태양복사열을 증발산량 단위 (mm day-1)로 환산한 값이다. TD는 일최고온도 (°C)에서 일최저온도 (°C)를 뺀 값이며, T는 일평균온도 (°C)이다.
PMET 산정공식은 (Eq. 3)과 같고, Allen et al. (1998)이 제안한 FAO PM 공식이다.
| $$PMET=\frac{0.408\triangle(R_n-G)+{\displaystyle\frac{\gamma900}{T+273u_2}}(e_s-e_a)}{\triangle+\gamma(1+0.34u_2)}$$ | (Eq. 3) |
PMET는 기준 증발산량 (mm day-1), Rn은 지표피복 상태 태양복사열 (MJ m-2 day-1), G는 토양열유동밀도 (MJ m-2 day-1), T는 지상 2 m 높이의 일평균온도 (°C), u2는 지상 2 m 높이의 풍속 (m s-1), es와 ea는 각각 포화수증기압 (kPa), 실제수증기압 (kPa)이고, Δ는 수증기압곡선 기울기 (kPa °C-1), γ는 건습계상수 (kPa °C-1)를 나타낸다.
통계분석
라이시미터, Hargreaves 공식, FAO PM 공식으로 산정된 기준 증발산량 (LYET, HSET, PMET) 간 적합도와 월별로 구분한 3종류 기준 증발산량의 적합도를 평가하였다. 적합도 평가는 SigmaPlot (SigmaPlot 10.0, Systat Software Inc., USA)을 이용하여 회귀분석 (regression analysis)을 실시하고 회귀식의 결정계수 (coefficient of determination, R2)를 결정하였다. 또한 기준 증발산량 (LYET, HSET, PMET)과 기상인자의 상관관계를 조사하였으며, 상관관계는 SPSS (statistical package for the social sciences, ver. 18.0, SPSS, Inc., Chicago, IL, USA)를 이용하여 Pearson’s correlation analysis를 실시하였다.
Results and Discussion
연구지역의 기상 특성
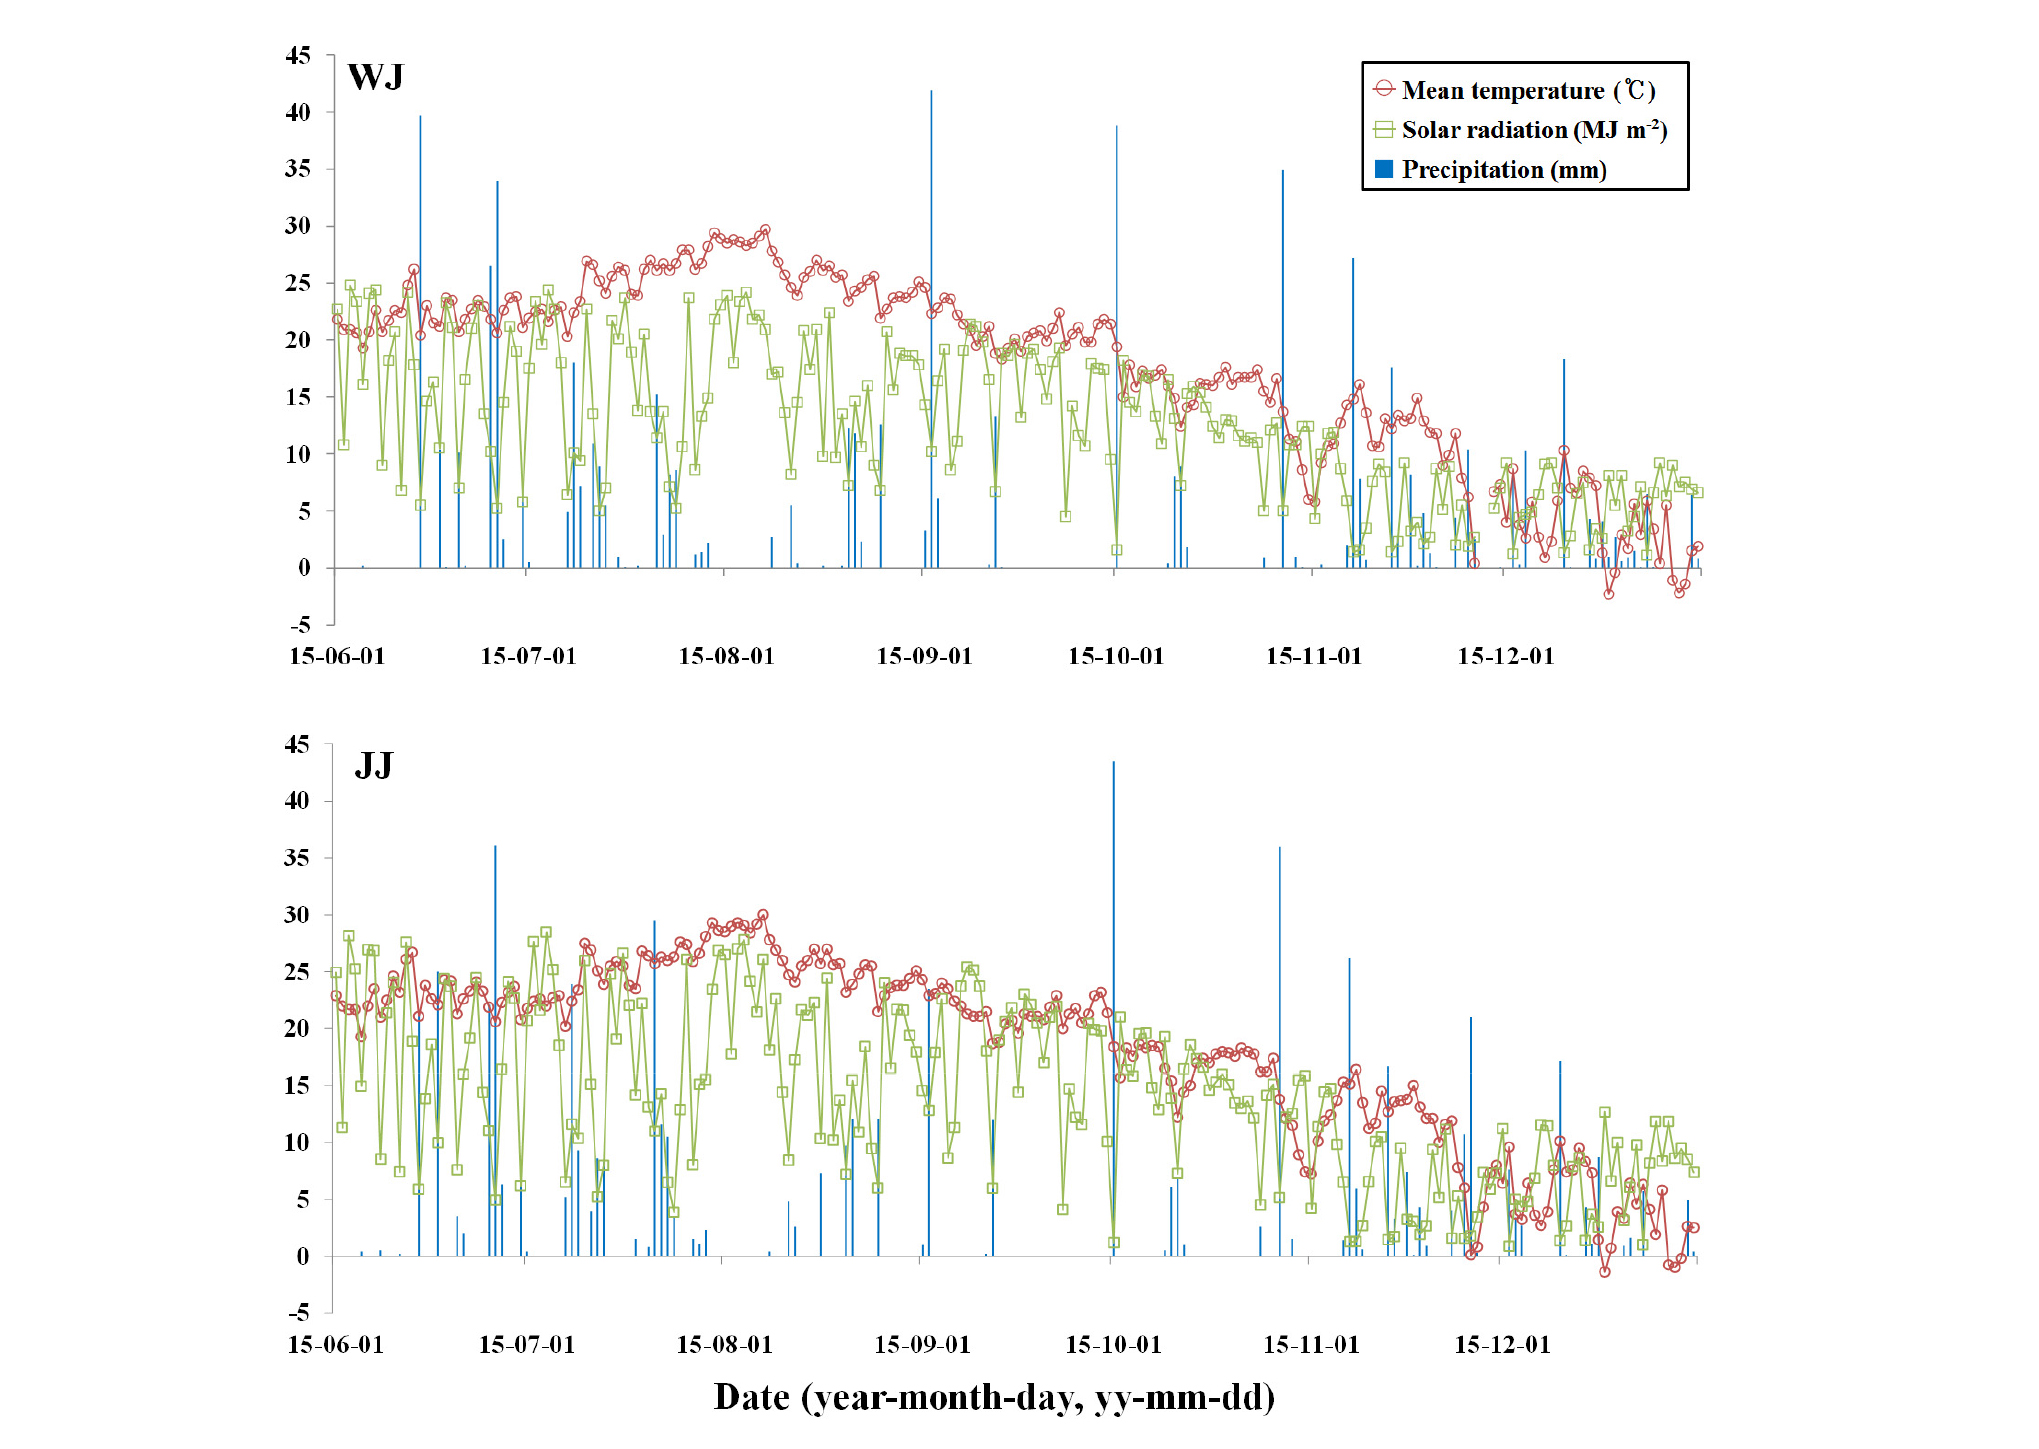
연구지점 및 전주지역의 2015년 6월 1일부터 2015년 12월 31일까지 기상자료 (평균온도, 일사량, 강우량)는 Fig. 1과 같다. 연구시점 6월 1일부터 온도가 서서히 증가하기 시작하여 7월 중순부터 8월 중순까지 평균온도가 높았으며, 8월 하순부터 온도가 서서히 낮아지기 시작하여 12월 중순 이후에는 영하온도를 기록하기도 하였다. 연구기간 동안 10 mm 이상 강우는 6월 5회, 7월 3회, 8월 3회, 9월 2회, 10월 2회, 11월 3회, 12월 2회로서 총 20회 기록하였다. 강우 발생일에는 일사량이 낮아졌으며, 평균온도가 낮아지는 8월 하순부터 일사량 또한 낮아지기 시작하였다. 전주지역 역시 7월 중순부터 8월 중순까지 평균온도가 높았으며, 8월 하순부터 온도가 서서히 감소하기 시작하여 12월 중순 이후 영하온도 일자도 발생하였다. 강우 발생일에 일사량이 낮아졌으며, 평균온도가 낮아지는 8월 하순부터 일사량 또한 낮아졌다. 연구지점과 전주지역의 기상 특성이 비슷함을 확인할 수 있었다.
산출방법에 따른 기준 증발산량의 관계
국립농업과학원 (전북 완주; Wanju, WJ) 라이시미터 기상시스템으로 관측된 기상자료와 완주에 인접한 전주 (Jeonju, JJ) 기상자료를 활용하여 기준 증발산량을 산출하였다. FAO Penman-Monteith (FAO PM) 공식 (Allen et al., 1998)과 Hargreaves 공식 (Hargreaves and Samani, 1985)으로 산출한 기준 증발산량 간 적합도 평가를 위하여 회귀분석을 실시하였다. 국립농업과학원 기상자료를 바탕으로 FAO PM 공식을 적용한 기준 증발산량은 PMET-WJ, Hargreaves 공식을 적용한 기준 증발산량은 HSET-WJ라 하였고, 전주 기상자료를 사용한 기준 증발산량은 각각 PMET-JJ, HSET-JJ라 하였다. 각각의 기준 증발산량 간 회귀분석을 실시하여 일차식 (linear equation)과 결정계수 (coefficient of determination, R2)를 산출하였다 (Fig. 2). PMET-WJ와 PMET-JJ의 회귀분석을 실시한 결과 기울기는 1.138, R2는 0.972로서 기울기가 1에 가깝고 결정계수가 높은 적합도를 나타내었다. PMET-WJ와 HSET-WJ의 회귀분석 기울기는 1.355 (R2=0.825), PMET-WJ와 HSET-JJ 기울기는 1.266 (R2=0.809), HSET-WJ와 PMET-JJ 기울기는 0.810 (R2=0.830), HSET-WJ와 HSET-JJ 기울기는 0.934 (R2=0.984), PMET-JJ와 HSET-JJ 기울기는 1.104 (R2=0.776)을 나타내었다. 공식 및 지역의 다양한 조건에서 결정계수 0.7 이상의 높은 값을 나타내어 적합도가 높은 것으로 나타났으며, 특히 동일공식 간 연구지점과 전주의 기준 증발산량 적합도는 기울기가 1에 가깝고 결정계수 0.9 이상의 높은 값을 나타내었다. 완주와 전주는 인접한 지역으로 기상조건이 비슷한 결과라 판단된다. Yoon and Choi (2018)는 서울, 부산, 대구 지역의 기준 증발산량을 Hargreaves 공식과 FAO PM 공식으로 산출한 결과 두 공식 간 상관성이 높음을 밝힌 바 있다.
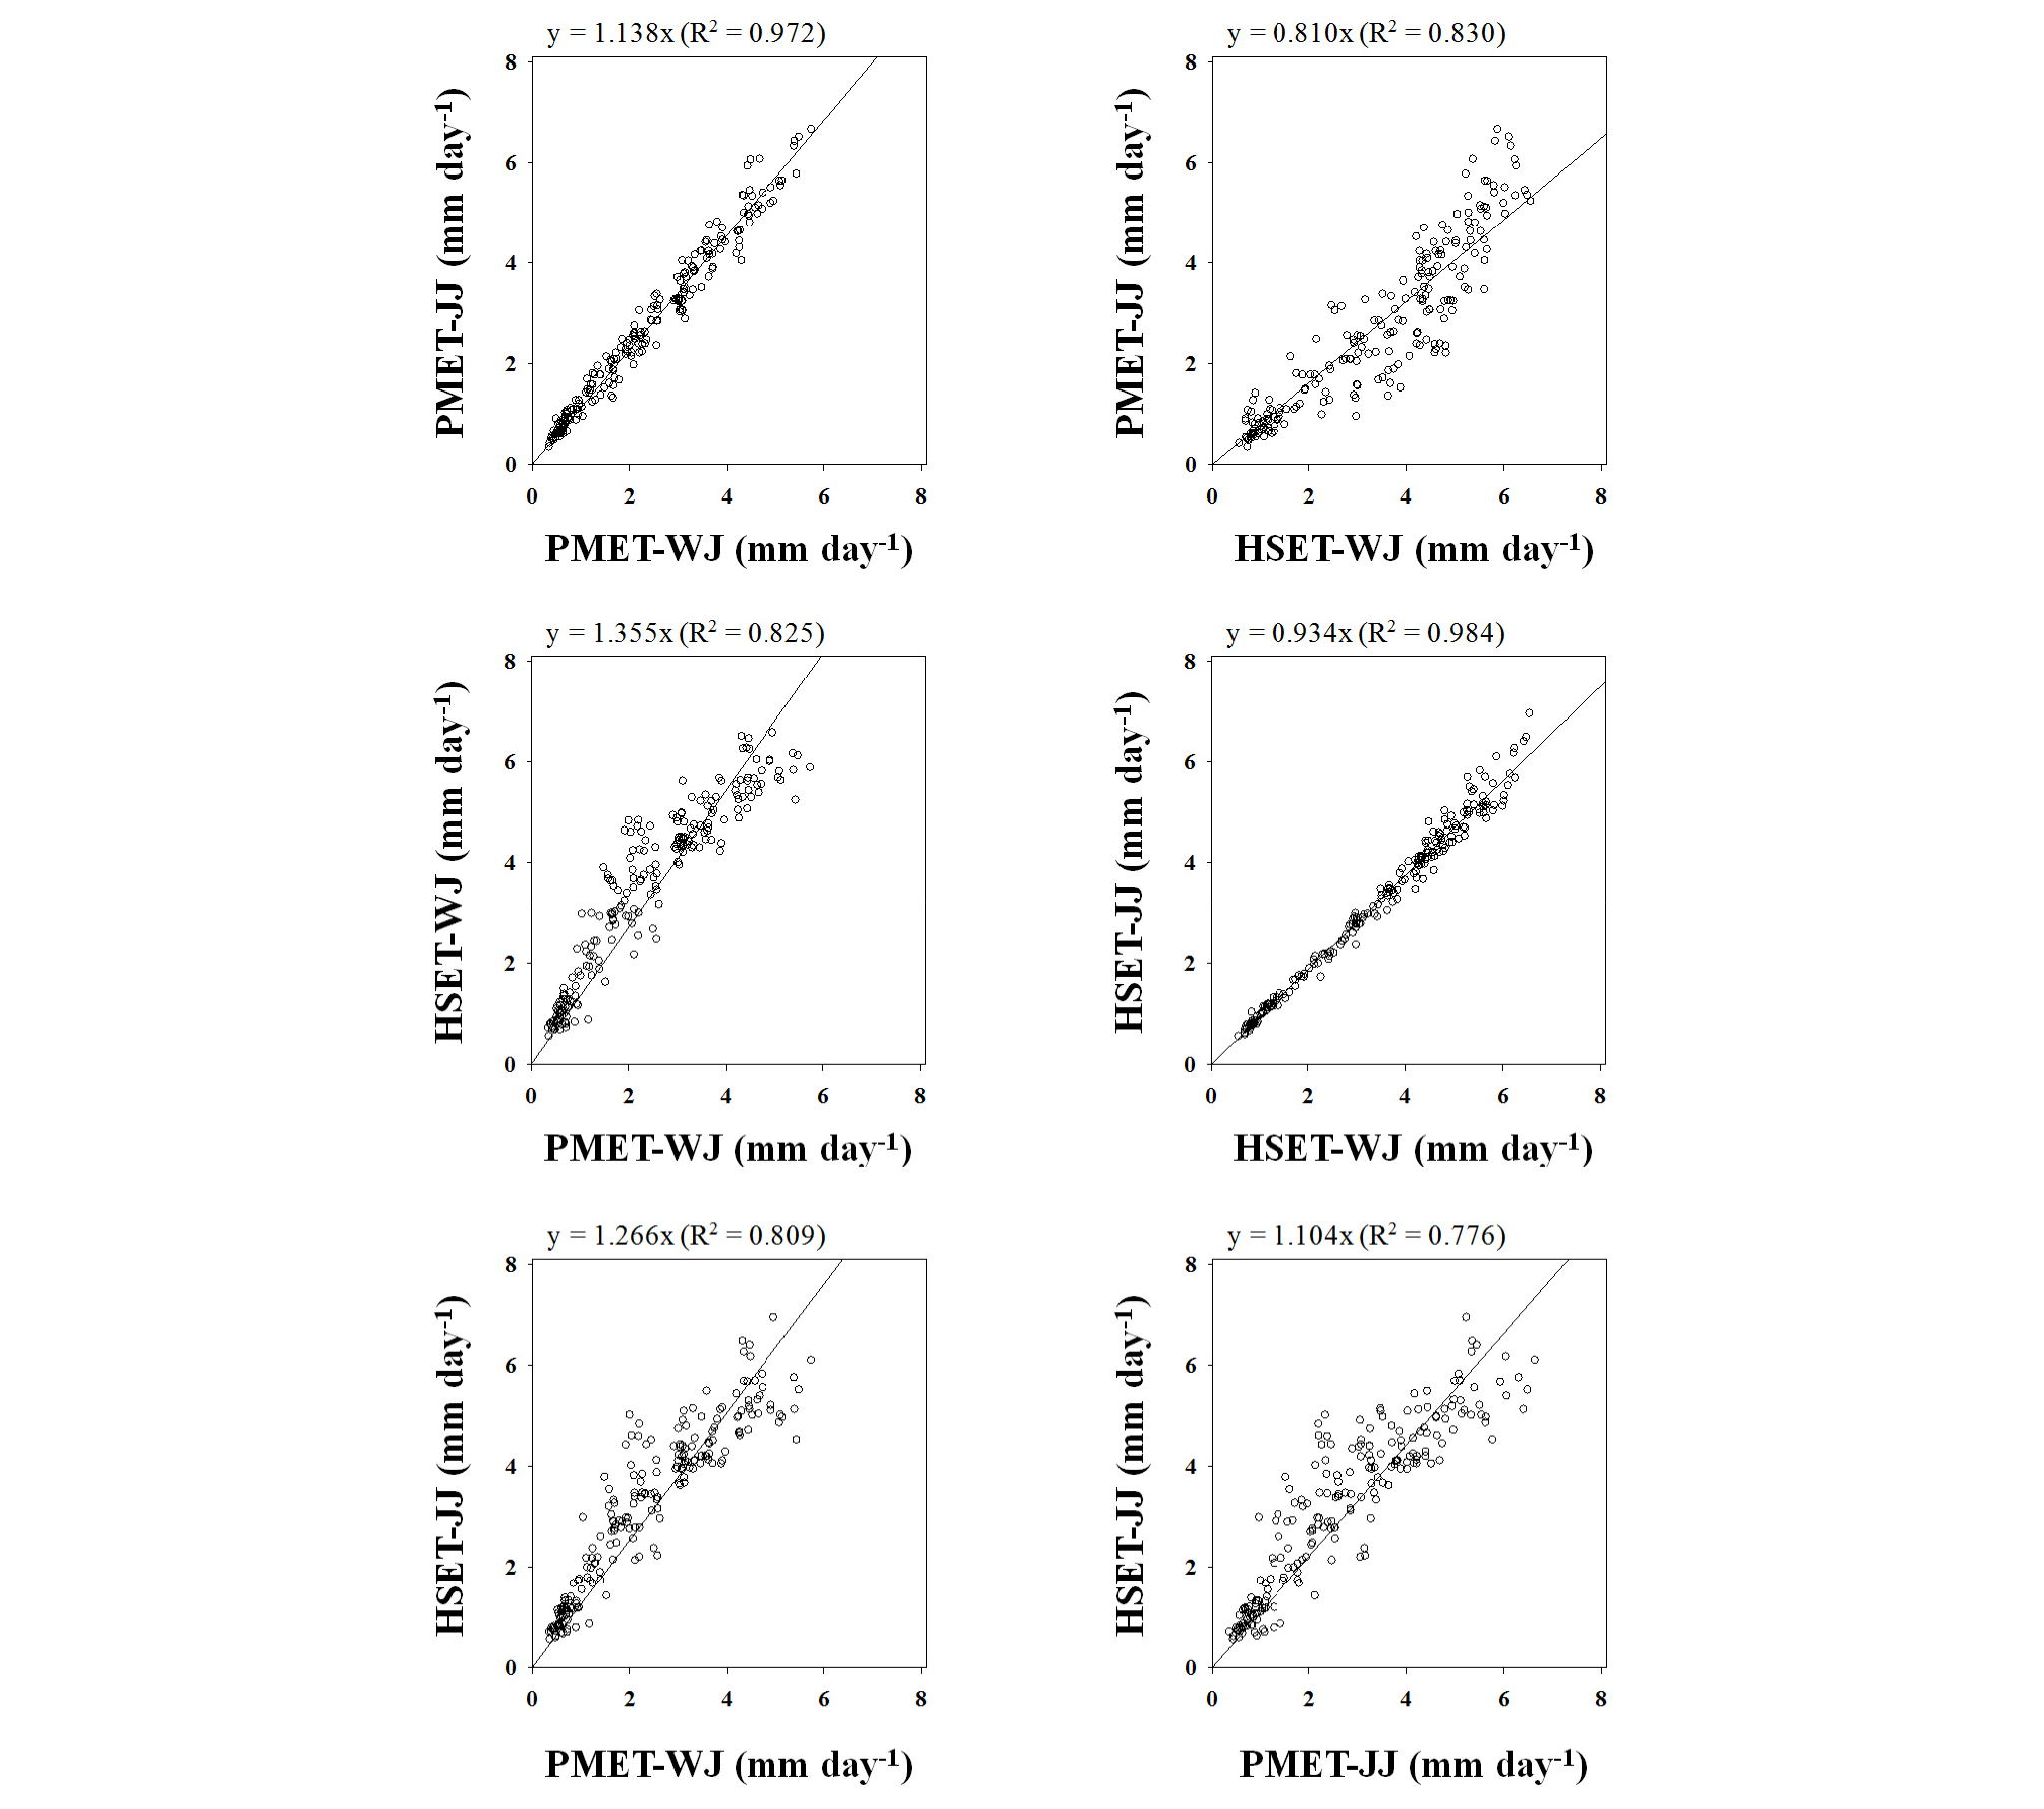
Fig. 2.
The linear equation and coefficient of determination (R2) between the PMET and HSET using the regression equations.
†PMET, reference evapotranspiration calculated by the FAO Penman-Monteith equation (Allen et al., 1998); HSET, reference evapotranspiration calculated by the Hargreaves equation (Hargreaves and Samani, 1985).
‡WJ, lysimeter station located at the National Institute of Agricultural Sciencese in Wanju; JJ, Jeonju.
§Missing data in 27th and 28th November, 2015 at lysimeter station (Wanju).
중량식 라이시미터를 이용하여 식양질 (fine loamy, FL)과 사양질 (coarse loamy, CL) 토양에서 기준 증발산량 (LYET)을 산출하였으며, FAO PM 공식을 이용한 PMET 및 Hargreaves 공식을 이용한 HSET와 적합도를 평가하였다. 일 경과에 따른 누적 기준 증발산량 결과는 Fig. 3과 같고, LYET-FL, LYET-CL 및 PMET-WJ는 비슷한 경향이었으나 HSET-WJ는 상대적으로 높은 값을 나타내었다. Hargreaves 공식을 활용할 경우, 풍속이 높은 지역은 과소 평가되고, 상대습도가 높거나 풍속이 낮으면 과대 평가되는 것으로 보고되어 있다 (Allen et al., 1998; Lee et al., 2004; Cordova et al., 2015; Kim et al., 2017). Lee and Park (2008), Moon et al. (2013)과 Seo et al. (2019)의 연구에서 우리나라 관측 지점을 해안지역과 내륙지역으로 구분하여 Hargreaves 공식을 이용한 기준 증발산량 산정 결과, 해안지역은 과소 산정, 내륙지역은 과대 산정되는 것으로 보고되었다. 본 연구에서는 Hargreaves 공식으로 산출된 기준 증발산량이 FAO PM 공식이나 라이시미터로 산출된 기준 증발산량 보다 과대 산정된 것으로 나타났다. 완주 및 전주 지역은 내륙지역으로서 해안지역보다 풍속이 낮아 과대 산정된 것으로 추정할 수 있다. 토양 특성에 따라서는 점토함량이 높은 식양질 (fine loamy, FL) 토양이 사양질 (coarse loamy, CL) 토양 보다 누적된 기준 증발산량이 높았으나, 7개월 동안 누적으로 감안하면 큰 차이를 보이지 않은 것으로 판단된다. Ok et al. (2018)의 연구에서 봄배추 재배기간 동안 미사질식양토와 사양토의 증발산량 차이는 없었으며, Han and Seo (2019)의 연구에서도 봄철 비경작 기간 동안 논토양의 점토함량에 따른 증발산량 차이는 나타나지 않았다.
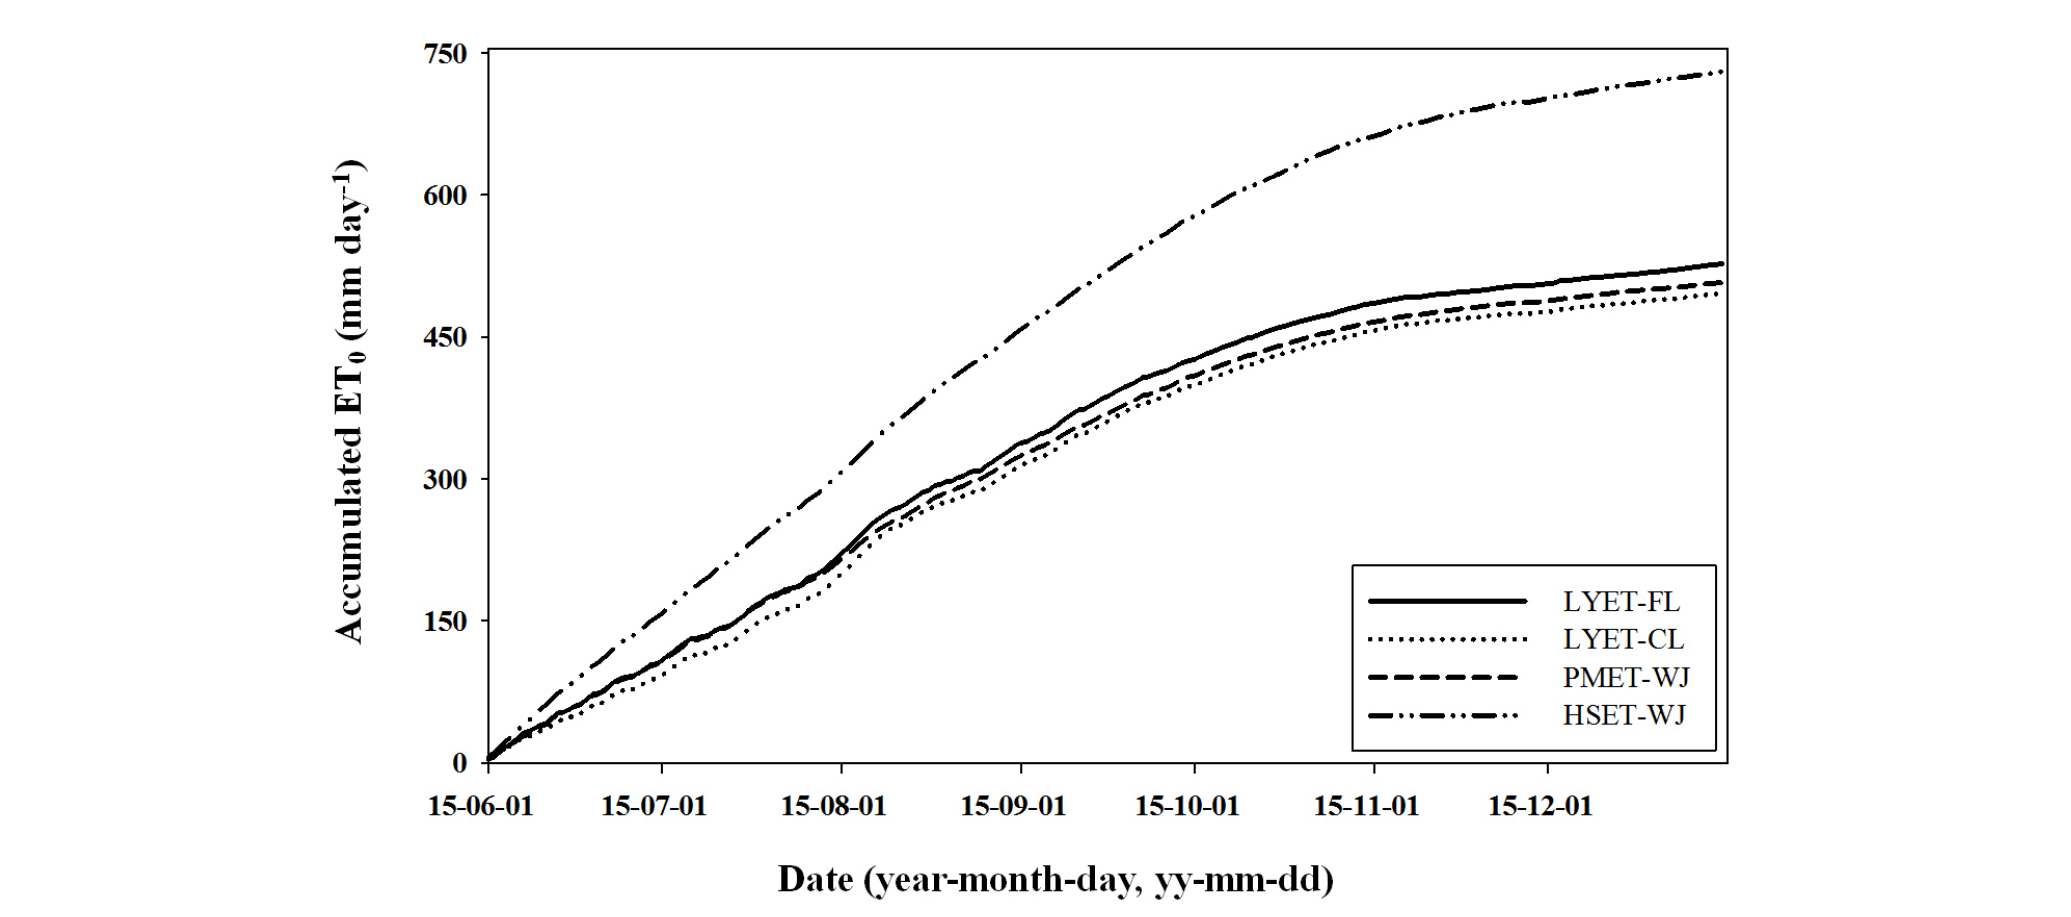
Fig. 3.
Changes in accumulated reference evapotranspiration in the study site from 1st June to 31th December in 2015.
†LYET, reference evapotranspiration calculated by the weighable lysimeter; PMET, reference evapotranspiration calculated by the FAO Penman-Monteith equation (Allen et al., 1998); HSET, reference evapotranspiration calculated by the Hargreaves equation (Hargreaves and Samani, 1985).
‡WJ, lysimeter station located at the National Institute of Agricultural Sciencese in Wanju; JJ, Jeonju.
§FL and CL are indicated fine loamy and coarse loamy in soil textural family, respectively.
∫Missing data in 27th and 28th November, 2015 at lysimeter station (Wanju).
LYET, PMET, HSET의 적합도를 평가한 결과, PMET-WJ와 LYET의 회귀분석 결과 FL 기울기 1.066 (R2=0.927), CL 기울기 1.003 (R2=0.905), PMET-JJ와 LYET는 FL 기울기 0.932 (R2=0.919), CL 기울기 0.877 (R2=0.897), HSET-WJ와 LYET는 FL 기울기 0.748 (R2=0.736), CL 기울기 0.703 (R2=0.709), HSET-JJ와 LYET는 FL 기울기 0.797 (R2=0.718), CL 기울기 0.747 (R2=0.676)를 나타내었다 (Fig. 4). LYET와 PMET는 기울기가 1에 가깝고 결정계수가 0.9 이상의 높은 적합도를 나타낸 반면, LYET와 HSET 관계는 기울기 0.703 - 0.797, 결정계수 0.676 - 0.736로서 상대적으로 낮은 적합도를 나타내었다. LYET는 y축에, HSET는 x축에 두고 기울기가 1보다 작으면서 1에 가깝지 않은 것으로 나타나 HSET가 과대 산정되었음을 알 수 있었다. Lee et al. (2008)과 Yoon and Choi (2018)는 Hargreaves 공식으로 기준 증발산량을 산정할 경우, 지역적 기후 특성에 맞는 매개변수 보정이 필요함을 제안하였다. 국내외 연구에서 Hargreaves 공식을 활용한 기준 증발산량 보정을 위해 기후 조건에 맞는 지역별 매개변수를 제시하였다 (Vanderlinden et al., 2004; Gavilan et al., 2006; Lee et al., 2008; Lee and Park, 2008; Moon et al., 2013; Seo et al., 2019). 라이시미터를 활용한 장기간 연구를 통해 자료 확보가 필요하며, 누적 자료를 바탕으로 매개변수 제시가 가능할 것이다.
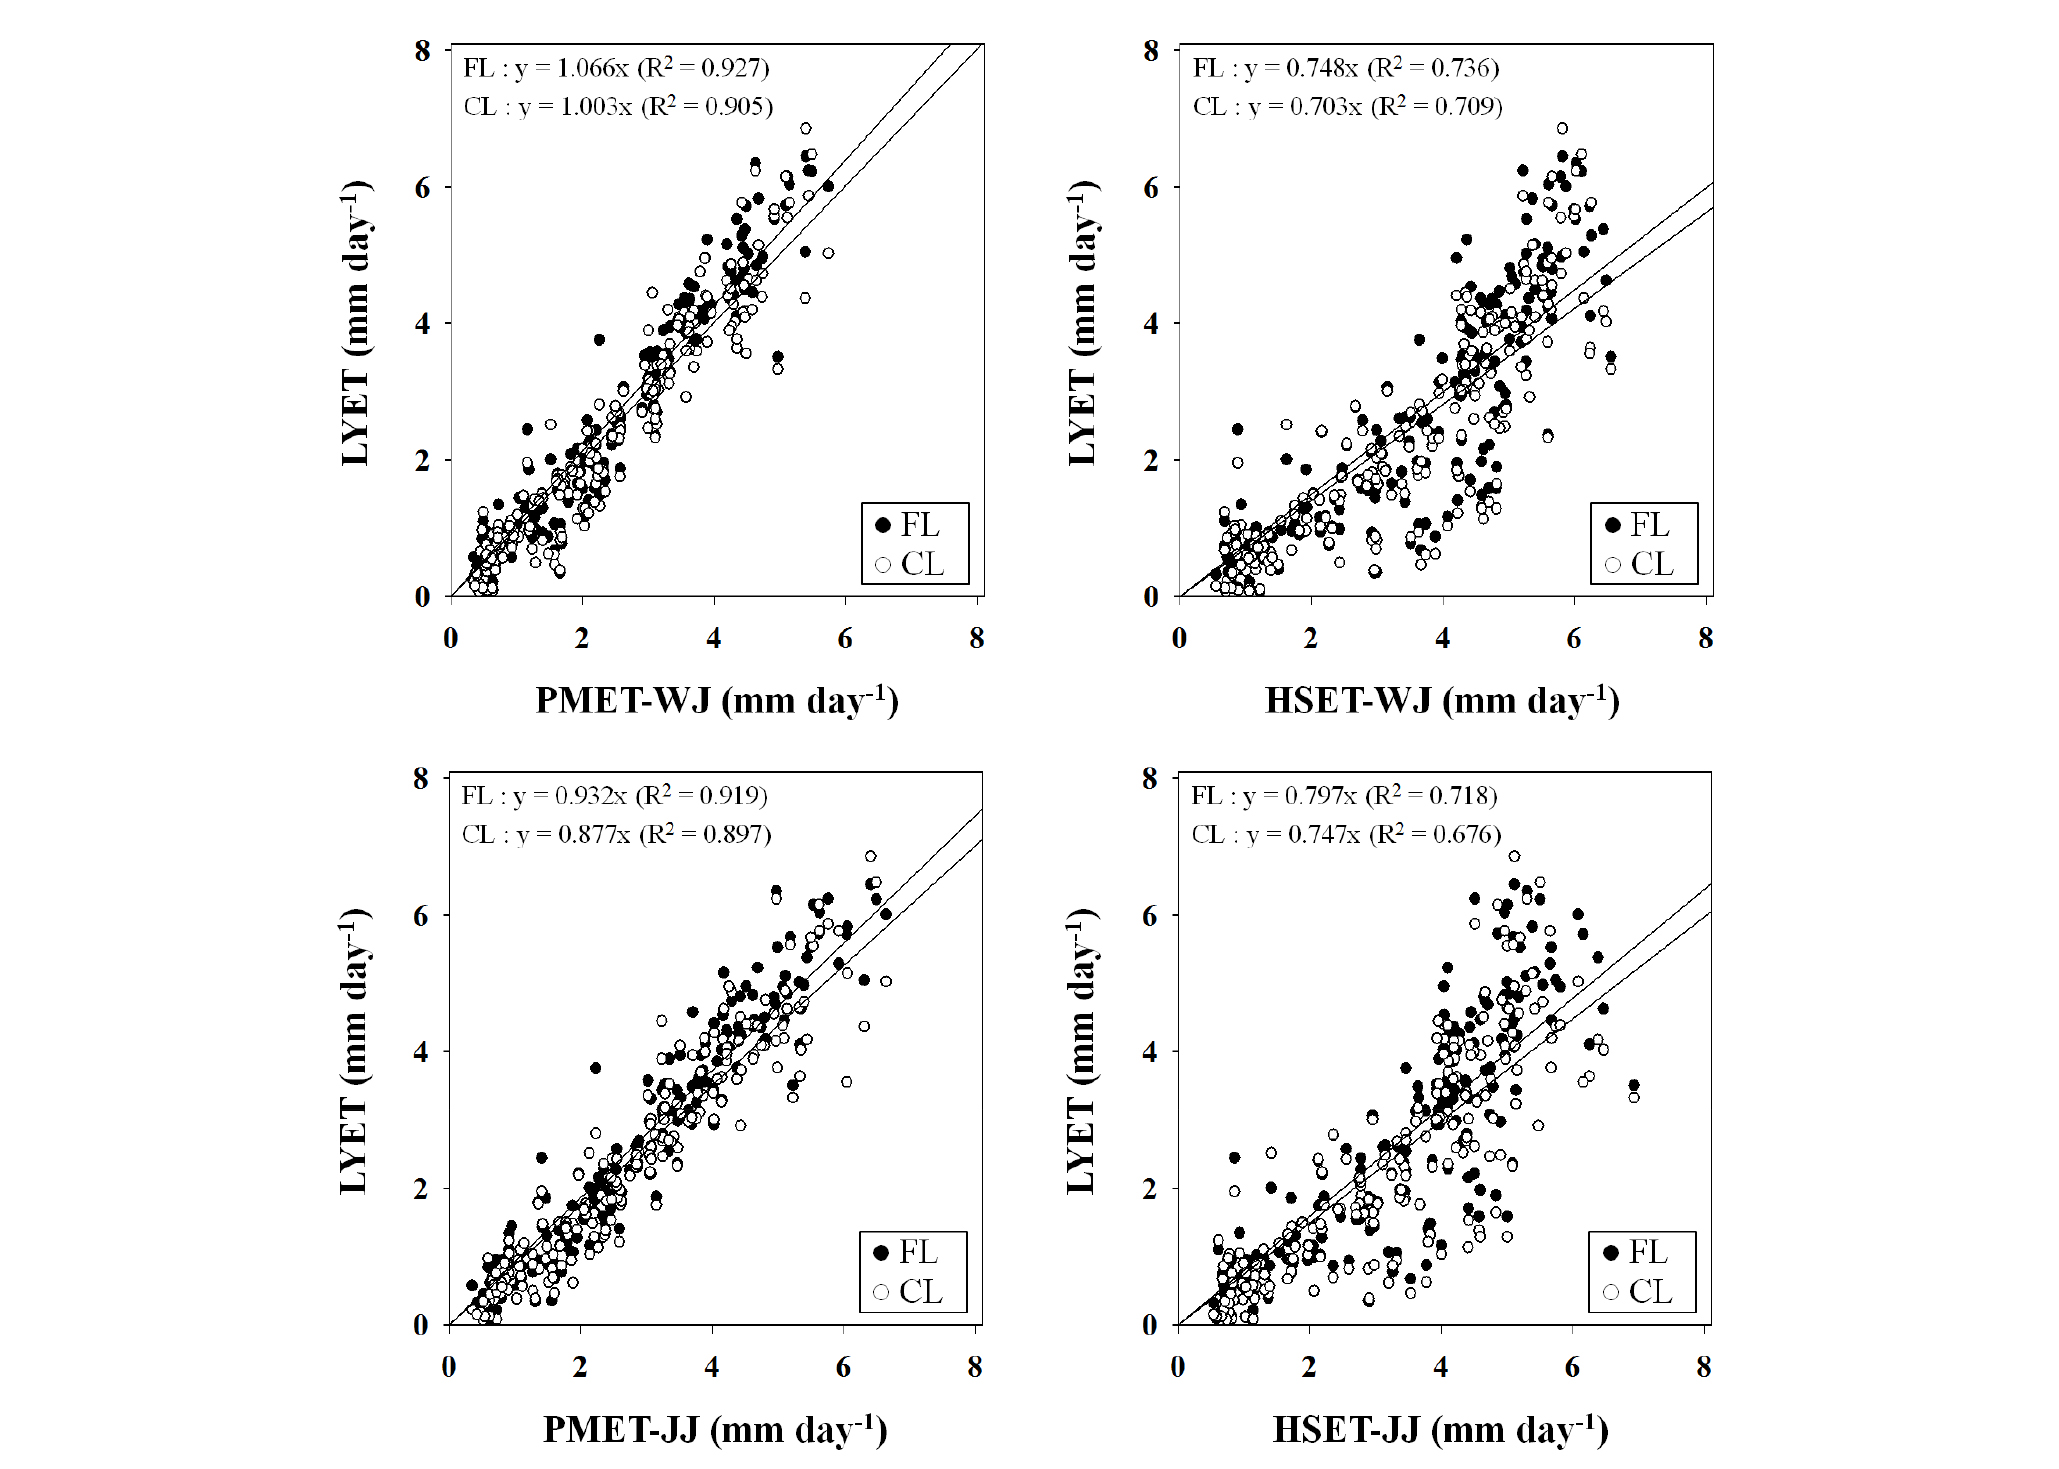
Fig. 4.
The linear equation and coefficient of determination (R2) between the LYET and PMET/HSET using the regression equations.
†LYET, reference evapotranspiration calculated by the weighable lysimeter; PMET, reference evapotranspiration calculated by the FAO Penman-Monteith equation (Allen et al., 1998); HSET, reference evapotranspiration calculated by the Hargreaves equation (Hargreaves and Samani, 1985).
‡WJ, lysimeter station located at the National Institute of Agricultural Sciences in Wanju; JJ, Jeonju.
§FL and CL are indicated fine loamy and coarse loamy in soil textural family, respectively.
∫Missing data in 27th and 28th November, 2015 at lysimeter station (Wanju).
월별 기준 증발산량의 관계
기준 증발산량을 월별로 구분하여 LYET, PMET 및 HSET 간 회귀분석을 실시한 결과 (Table 2), LYET와 PMET-WJ의 6월 - 10월 동안 기울기는 0.876 - 1.103로서 1에 가까웠고 결정계수는 0.790 - 0.884로 나타났다. 11월과 12월 동안 기울기는 1에 가까운 반면 결정계수가 0.406 - 0.683으로 낮은 적합도를 나타내었다. LYET와 HSET-WJ는 기울기 0.516 - 808, 결정계수 0.000 - 0.615로서 기울기와 결정계수 모두 낮게 나타났으며, 특히 12월의 결정계수는 0.000으로 적합도를 논하기 어려운 결과이다. LYET와 PMET-JJ의 6월 - 10월 동안 기울기는 0.757 - 0.995, 결정계수는 0.760 - 0.878이었으며, 11월과 12월의 결정계수는 0.439 - 0.737로서 적합도가 낮은 것으로 나타났다. LYET와 HSET-JJ의 기울기는 0.550 - 0.885, 결정계수는 0.000 - 0.578로서 낮은 적합도를 나타내었다. LYET와 PMET는 6월 - 10월은 높은 적합도를 11월과 12월은 낮은 적합도를 나타내었으며, LYET와 HSET는 6월부터 12월까지 모두 적합도가 낮게 나타났다. FL과 CL 두 토양 간 뚜렷한 차이는 보이지 않았다. 한국잔디는 여름에는 생육이 왕성하지만 늦가을부터 봄까지 휴면기에 들어가 (Kim, 1991) 월별 생육 차이로 인하여 증발산량에 영향을 준 것으로 판단된다. Huang and Fry (2000)는 잔디 생육 상태가 증발산에 영향을 주는 것으로 보고하였고, Bae et al. (2013)의 연구에서 한국잔디는 10월 중순 이후 휴면이 시작되어 지상부 생체중이 감소하였다. 늦가을 이후 라이시미터로 산정된 기준 증발산량은 적합도가 낮게 평가된 바, 1월부터 12월까지 전 생육기간을 연구하여 보정계수 산정 등을 고려할 필요가 있다. 또한 매년 변화하는 기후변화에 대응하기 위해서 장기간 모니터링 등 후속 연구가 필요하다.
Table 2. The linear equation and coefficient of determination (R2) between the LYET and PMET/HSET using the regression equations.
Allen et al., 1998); HSET, reference evapotranspiration calculated by the Hargreaves equation (Hargreaves and Samani, 1985).‡WJ, lysimeter station located at the National Institute of Agricultural Sciencese in Wanju; JJ, Jeonju.
§FL and CL are indicated fine loamy and coarse loamy in soil textural family, respectively.
∫Missing data in 27th and 28th November, 2015 at lysimeter station (Wanju).
기준 증발산량과 기상인자의 상관관계
기준 증발산량과 기상인자 간 상관관계를 조사한 결과는 Table 3과 같다. LYET, PMET, HSET 모두 최저온도, 최고온도, 평균온도, 일사량과는 고도로 유의한 정의 상관관계 (p < 0.01)가 있는 것으로 나타났고, 평균습도와는 고도로 유의한 부의 상관관계 (p < 0.01)가 나타났다. LYET와 PMET는 강수량과 고도로 유의한 부의 상관관계 (p < 0.01)가 있는 반면, HSET와 강수량은 상관성이 낮은 것으로 나타났다. 풍속과 기준 증발산량의 상관관계에서 PMET-JJ (정의상관, p < 0.05) 외에는 상관성이 나타나지 않았다. 잔디 기준 증발산량은 온도 (Beard, 1973; Feldhake et al., 1985), 일사량 (Feldhake and Boyer, 1986; Kim and Beard, 1988; Beard et al., 1992), 상대습도 (Beard, 1973; Beard, 1985), 바람 (Grace, 1974; Grace and Russell, 1977) 등 기상인자의 영향을 받는다. Beard (1973)는 상대습도가 감소하면 증발산량이 증가한다고 하였으며, 본 연구에서 평균습도와 기준 증발산량은 부의 상관관계로 나타났다. 풍속은 덥고 건조한 조건에서 증발산량을 증가시키지만 덥고 습한 조건에서는 증발산량 변화에 영향을 주지 못한다 (Allen et al., 1998). 풍속은 다른 기상인자와 복합적으로 작용하여 기준 증발산량과 상관성이 나타나지 않은 것으로 판단된다.
Table 3. The values of correlation coefficient (r) among the reference evapotranspiration and meteorological factors.
Allen et al., 1998); HSET, reference evapotranspiration calculated by the Hargreaves equation (Hargreaves and Samani, 1985).‡WJ, lysimeter station located at the National Institute of Agricultural Sciencese in Wanju; JJ, Jeonju.
§FL and CL are indicated fine loamy and coarse loamy in soil textural family, respectively.
∫Missing data in 27thand28thNovember,2015atlysimeterstation(Wanju).
∬Correlation coefficient (r) was determined by Pearson correlation analysis to evaluate the relationship between parameters. Results were evaluated with 95% and 99% confidence intervals; *, significant at p < 0.05, and **, significant at p < 0.01 level.
Conclusion
본 연구에서는 중량식 라이시미터, FAO Penman-Monteith (FAO PM) 공식, Hargreaves 공식을 이용하여 기준 증발산량 (순서대로 LYET, PMET, HSET)을 산정하였다. 산정된 기준 증발산량 간 회귀분석을 실시하여 적합도를 평가하였으며, 라이시미터로 산정된 기준 증발산량을 검증하고 그 이용 가능성을 논하고자 하였다. 라이시미터 연구지역 (국립농업과학원, 전북 완주; WJ) 기준 증발산량은 기상 조건이 비슷한 인근 전주 (JJ) 지역과 비교하였으며, 동일 공식 간 PMET-WJ:PMET-JJ는 기울기 1.138, 결정계수 (coefficient of determination, R2) 0.972, HSET-WJ:HSET-JJ는 기울기 0.934 (R2=0.984)로서 적합도가 높은 것으로 나타났다. 다른 공식간에도 결정계수 (R2) 0.7 이상의 높은 적합도를 나타내었다. LYET는 두 토양 (fine loamy, FL; coarse loamy, CL) 모두 PMET와 결정계수 0.9 이상으로 적합도가 높게 나타났으며, HSET와는 적합도가 상대적으로 낮게 나타났다 (결정계수 0.676 - 0.736). 월별로는 PMET:LYET 적합도가 HSET:LYET 보다 높았으며, 11월과 12월에는 잔디가 휴면기에 접어들면서 PMET:LYET의 결정계수도 0.7 이하로 낮아졌다. 기준 증발산량과 기상인자 간 상관관계는 LYET, PMET, HSET 모두 최저온도, 최고온도, 평균온도, 일사량과 고도로 유의한 정의 상관관계 (p < 0.01)가 나타난 반면, 평균습도와는 고도로 유의한 부의 상관관계 (p < 0.01)가 나타났다. 라이시미터로 산정된 기준 증발산량은 FAO PM 공식으로 산정된 기준 증발산량과 적합도가 높은 것으로 평가되어 정밀한 기준 증발산량 산정에 라이시미터 이용 가능성이 높음을 확인하였다. 따라서 농경지의 정밀한 수분이동 측정이 가능할 것으로 기대된다.
