

Introduction
Soil is one of the most complex biomaterials (Young and Crawford, 2004), which plays a crucial role in plant growth and crop production, and also has vital roles that affect human health (Oliver, 1997; Abrahams, 2002; Wienhold et al., 2004; Alley and Vanlauwe, 2009). However, soil is exposed to pollutants, such as various chemicals, that are byproducts of human activities, and the influx of such pollutants into farmlands and urban areas is a serious issue (Jelusic and Lestan, 2014). In particular, after the Industrial Revolution industrial activities have led to a continued increase in environmental pollution (Stigliani et al., 1991). Remediation of contaminated soil is implemented by applying various remediation and restoration techniques based on the site characteristics (60Salt et al., 1995; Mulligan et al., 2001, Tokunaga and Hakuta, 2002; Varanasi et al., 2007; Sere et al., 2008; Hafeez et al., 2014); however, biological, physical, and chemical changes and different soil properties exist in remediated soil according to the remediation technique applied (Neale et al., 1997; Tsang et al., 2007; Cébron et al., 2009; Jelusic et al., 2013). Such remediated soil is being used in landfills, industrial sites, and road construction, and there is the possibility that pollutants that remain in the remediated soil below allowable levels will diffuse (van Hees et al., 2008; Elgh-Dalgren et al., 2011). Therefore, there is a need for eco-friendly remediation techniques that suit the continued use and management of soil, and when remediated soil is reused, soil assessments corresponding to the purpose of such use must be performed (van Hees et al., 2008; Jelusic et al., 2014a). Because issues such as climate change, global warming, and soil erosion affect crop production, there is a demand for management to sustain agriculture (Tilman et al., 2002; Komatsuzaki and Ohta, 2007; Lal, 2008). Therefore, efforts should be made to examine such measures in order to broaden the use of remediated soil. Recently, many international studies on the sustained management of remediated soil have been performed, including the biological assessment of urban soil after remediation (Hartley et al., 2008), biological functions of remediated garden soil (Jelusic et al., 2013), and assessment of plant adaptability to remediated soil (Jelusic et al., 2014b). However, studies on the agricultural use of remediated soil are very much lacking. Although studies in Korea have investigated the elimination of pollutants using ultrasound (Jung et al., 2009), on-site application of low temperature thermal desorption system (Oh et al., 2012), and effects of remediation methods on soil properties (Yi et al., 2012), studies have been conducted mostly at the level of contaminated soil remediation methods, whereas studies related to reuse of remediated soil are clearly lacking. To reuse remediated soil with altered soil properties for agriculture, the improvement of both soil properties and quality is essential. Soil quality is important for achieving sustainable agriculture (Miller and Wali, 1995; Warkentin, 1995), and is closely linked to crop production, thus maintaining ecosystem and soil function, such as self-remediation capability (Olson et al., 1996; Garrigues et al., 2012; Legaz et al., 2017). Numerous researchers have introduced methods to quantify indices for soil quality into numeric values (Wymore, 1993; Karlen and Stott, 1994; Sharma et al., 2005), and Yoon et al. (2004) introduced a method of rice paddy and field soil quality assessment suitable for Korea. Although differences exist among scholars regarding the indices selected for soil quality assessment, the physical, chemical, and biological properties of soil serve as important indices and are very closely associated with soil quality (Glover et al., 2000; Yoon et al., 2004; Wienhold et al., 2004; Sharma et al., 2005; Legaz et al., 2017). Livestock manure compost, charcoal, and biochar are actively being studied as soil conditioners that can improve these soil properties and contribute to plant nutrient supply (Grandy et al., 2002; Meng et al., 2005; Bell and Worrall, 2011; Omil et al., 2013; Mankasingh et al., 2011; Jones et al., 2012). Previous study showed that the remediated soil have high soil pH value and exchangeable Ca concentration but low exchangeable K concentration (Kim et al., 2013). Thus, the applications of biochar, charcoal, and livestock manure compost are ways to improve the different type of remediated soils. Agricultural use of remediated soil requires improvements of soil properties and continuous management of soil, as well as qualitative assessment of soil. Accordingly, this study selected livestock manure compost, charcoal, and biochar as organic amendments for improving quality and properties of remediated soil, and investigated the effects on the changes in the properties of remediated soil treated with different organic amendments. Moreover, a qualitative assessment was performed on the remediated soil to identify the effects of soil quality improvement.
Materials and Methods
Soil preparation
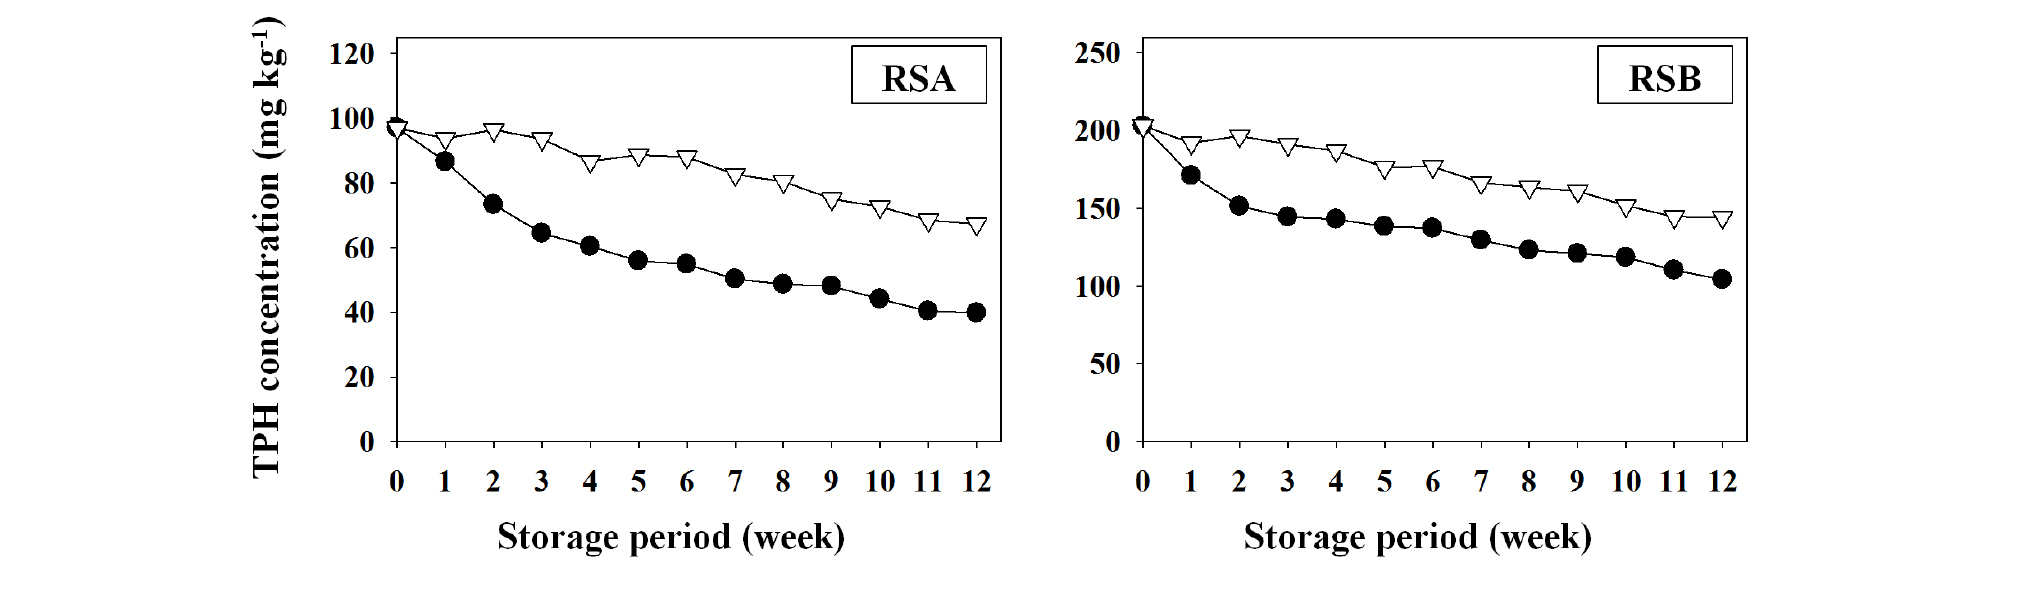
Two types of remediated soil, remediated soil A and B (RSA and RSB), with different properties were provided from a company specialized in the remediation of contaminated soil. The remediated soils were previously contaminated with different concentrations of total petroleum hydrocarbons (TPH) and remediated by the landfarming technique. Soil samples were obtained by sieving with a 2.0-mm soil sieve after air-dried and crushed. The selected physical and chemical properties of the soils used in this study are shown in Table 1. In particular, RSA previously contained much lower concentration of residual TPH than in RSB (Fig. 1). More detailed properties of the soils also presented in previous study (Kim et al., 2013).
Table 1. Selected chemical and physical properties of soils used in this study.
‡EC, electrical conductivity; SOM, soil organic matter; TN, total nitrogen; CEC, cation exchange capacity; TPH, total petroleum hydrocarbons.
§ ND, not detected.
Preparation of different organic amendments as soil conditioners
Three different organic amendments were used as soil conditioners: a livestock manure compost (LC), which was produced by a composting process and procured from YOYO Korea in Jeongeup City, Jeonbuk Province; a charcoal (CC) was produced from charcoal kiln in Hongcheon City, Gangwon Province; and a biochar (BC) was produced under slow pyrolysis conditions at 350°C. The chemical properties of these conditioners were determined in accordance with the methods of soil chemical analysis introduced by the National Institute of Agricultural Sciences at the Rural Development Administration, Korea (NAS-RDA) (NAAS, 2010b). Electrical conductivity (EC) and pH were measured using a pH and EC meter (Professional Meter PP-20, Satorius, Germany) after mixing the sample with distilled water at a ratio of 1:5 (w:v), and shaking the mixture. Organic matter (OM) content was calculated with dry and ash weight. Nitrogen (N) content in the samples was measured from Kjeldahl distillation after sulfuric acid decomposition, and phosphorus (P) content was measured using a UV/Vis spectrophotometer (DU 720, Beckman, Coulter, USA) after completing HNO3-HClO4 wet-digestion process. The concentrations of potassium (K), calcium (Ca), magnesium (Mg), and sodium (Na) were measured using an Inductively Coupled Plasma Optical Emission Spectrometry (ICP-OES, Optima 7300DV, Perkin Elmer, USA). The chemical properties of different organic amendments used in this study are shown in Table 2. More detailed properties of the organic amendments also presented in previous study (Kim et al., 2013).
Table 2. Chemical properties of different organic amendments as soil conditioners.
‡EC, electrical conductivity; OM, organic matter.
§ ND, not detected.
Treatment conditions for remediated soils
After each 400 g of RSA and RSB was weighed by placing in separate polypropylene pots, the soils in pots were treated with BC, CC, and LC in levels of 0.0% (Control), 1.0%, and 5.0% per dry soil weight. Deionized water (18.2 MΩ) was used to maintain the moisture content at field capacity and the samples were incubated at room temperature (24 ± 2°C) with good ventilation. Subsequently, the soil samples were collected after 2, 4, 8, and 16 weeks, and the collected samples were air-dried and crushed again for soil analysis.
Soil analysis
Among the physical properties of soil, soil texture was determined in accordance with the sedimentation pipette method described by Gee and Bauder (1986), followed by the use of a soil texture triangle as described by the United States Department of Agriculture (USDA). Soil chemical analysis was performed in accordance with the method described by NAS-RDA (NAAS, 2010b). Among the chemical properties of soil, soil pH and EC were measured by mixing the soil sample with distilled water at a 1:5 (w:v) ratio using a pH and EC meter (Professional Meter PP-20, Sartorius, Germany). The soil organic matter (SOM) was measured by Tyurin method. Total nitrogen (TN) content in the soil samples was determined by the Kjeldahl distillation method. Available phosphorus as P2O5 was measured in accordance with the Lancaster method at wavelength of 720 nm using a UV/Vis Spectrophotometer (DU 720, Beckman, Coulter, USA). Exchangeable cations (K, Ca, Mg, and Na) were extracted by 1.0 M ammonium acetate (CH3COONH4) solution (pH 7.0) and were determined using an Inductively Coupled Plasma Optical Emission Spectrometry (ICP-OES, Optima 7300DV, Perkin Elmer, USA). Cation exchange capacity (CEC) was measured by ammonium acetate method. All samples were prepared in duplicate.
Total petroleum hydrocarbons analysis and degradation study
Total petroleum hydrocarbons (TPH) in soil were analyzed in accordance with the TPH analysis procedures in the standard analytical methods for soil pollution by Ministry of Environment in Korea (ME, 2012). Dichloromethane (HPLC grade, CAS No. 75-09-2, TEDIA, USA) was added to 10-25 g of wet soil samples (soil samples for moisture content measurement dried simultaneously), and an ultrasonic processor (Vibra cell VC750, Sonics & Materials, Inc., USA) was used for ultrasonic extraction. Subsequently, after purification, concentration, and a constant volume process, a Gas Chromatography Flame Ionization Detector (GC-FID, 6890 series GC system, Agilent, USA) was used for measurements. To examine the natural degradation or attenuation characteristics of TPH, the other two sets of remediated soil A and B (RSA and RSB) still contained different levels of TPH residuals were procured from a company specialized in remediation of contaminated soil. RSA and RSB were refrigerated (4 ± 1°C) and stored by natural storage (24 ± 2°C), respectively, and the TPH analysis was performed using a specific amount of sample prepared over 12 weeks. The methods used in the analysis were the same as those described above.
Soil quality assessment
Soil quality was assessed using two different methods (Yoon et al., 2004) as follows: Method 1 is shown as Equation 1 that calculate soil quality index (SQI) based on the score of soil quality indicator rating, whereas Methods 2 (Eq. 2) estimate weight additive soil quality index (SQIW) by applying weight value of SQI. Table 3 shows the score of soil quality indicator rating and weight value of soil quality index for each soil property (Yoon et al., 2004).
Table 3. Soil quality indicator rating and weight value for upland (Yoon et al., 2004).
‡SQI, soil quality index (calculated from sum of soil quality indicator scores).
Method 1:
| $$SQI=\frac{Sum\;of\;each\;soil\;quality\;indicator\;score}{Number\;of\;soil\;properties\;selected}$$ | (Eq.1) |
Method 2:
| $$SQI_w=\frac{\sum_{i=1}^nW_i\times S_i}{\sum_{i=1}^nW_i}$$ | (Eq.2) |
†SQIW, weight additive soil quality index; W, weight value; S, each soil quality indicator score
Statistical analysis
Statistical analyses were carried out using Statistical Package for the Social Sciences (SPSS) ver. 18.0 (SPSS Inc., Chicago, IL, USA). Duncan’s multiple range test was performed to check for the significance of soil chemical properties and soil quality indicators based on the organic amendment treatment, whereas Pearson’s correlation analysis was used to examine the relations between the soil chemical properties and soil quality indices.
Results and Discussion
Total petroleum hydrocarbons (TPH) degradation
Total petroleum hydrocarbons (TPH) was not detected in remediated soil samples, RSA and RSB (Table 1). The Soil Environment Conservation Act by Ministry of Environment in Korea (ME, 2017) defined levels of soil contamination warning standard of TPH as 500 mg kg-1 (region 1), 800 mg kg-1 (region 2), and 2,000 mg kg-1 (region 3). TPH levels of soil contamination emergency standard are 2,000 mg kg-1, 2,400 mg kg-1, and 6,000 mg kg-1 for region 1, 2, and 3, respectively. An environmental perspective do not have inherently negative effects on TPH (in remediated soils used in this study). In particular, TPH was not detected in both soil samples, which might be due to the additional degradation and volatilization of TPH during the process of air-drying over a long period after completing the soil remediation. A study by Reynolds et al. (1994) showed that when the areas within the State of Arkansas in USA were contaminated with petroleum, the areas were remediated for 7 weeks by landfarming. The TPH degradation was occurred over 95%, which was from the initial TPH concentrations of 6,200 mg kg-1 to the final TPH concentrations of 280 mg kg-1. Wingrov (1997) also reported that when petroleum-contaminated areas in the State of Manitoba in Canada were remediated by landfarming, TPH concentration of above 13,000 mg kg-1 was reduced to below 250 mg kg-1. In a study by Yi et al. (2012), TPH level of 1,000-3,000 mg kg-1 in contaminated soil was attenuated to approximately 50 mg kg-1 after 3 months of self-remediation using landfarming technique.
Because of considering the potential for TPH attenuation in RSA and RSB during the air drying and crushing process, RSA and RSB samples were analyzed to determine the changes in TPH concentration by natural degradation and attenuation (Fig. 1). At the beginning of this experiment, TPH residuals in RSA and RSB contained 97 mg kg-1 and 203 mg kg-1, respectively. During the storage at 4 ± 1ºC, no attenuation occurred for the first 3 weeks, but then TPH concentration began to decrease thereafter. However, when the samples were stored at room temperature (24 ± 2ºC), attenuation was observed at the first week and continued to reduce TPH concentration to 48 mg kg-1 (about 50% of the baseline level) by the tenth week. RSB initially showed a baseline level of 203 mg TPH kg-1. During refrigerated storage, TPH degradation in RSB was also observed from the third week onwards. However, during the storage at room temperature, TPH attenuation occurred from the first week, and TPH concentration in the sample decreased approximately 50% (104 mg TPH kg-1) of the initial level by the twelfth week. Makadia et al. (2011) reported that more than 50% of TPH concentration in a contaminated soil was decreased within 3 weeks, which was from the initial concentration of > 20,000 mg kg-1 to the finial concentration of < 10,000 mg kg-1. In addition, over 12 weeks, 86% of TPH was removed by natural attenuation. Kim and Lee (2011) reported that a soil polluted with a mixture of diesel, kerosene, and gasoline contained 25,000 mg kg-1 of TPH, and the half-life of TPH in the soil was 83.6 days under natural attenuation condition. On the other hand, when the soil polluted only with diesel had 20,000 mg kg-1 of TPH, and under the natural attenuation, the half-life of TPH was 49.9 days. These results indicate that soil itself possesses natural attenuation capability against petroleum-based pollutants, and thus long-term management of soil efficiently minimizes negative impacts of TPH contamination.
Changes in soil properties
The changes in selected properties of the different remediated soils, RSA and RSB, as affected by the applications of different organic amendments as soil conditioners during the 16-week incubation are shown in Figs. 2, 3, 4, 5, and 6.
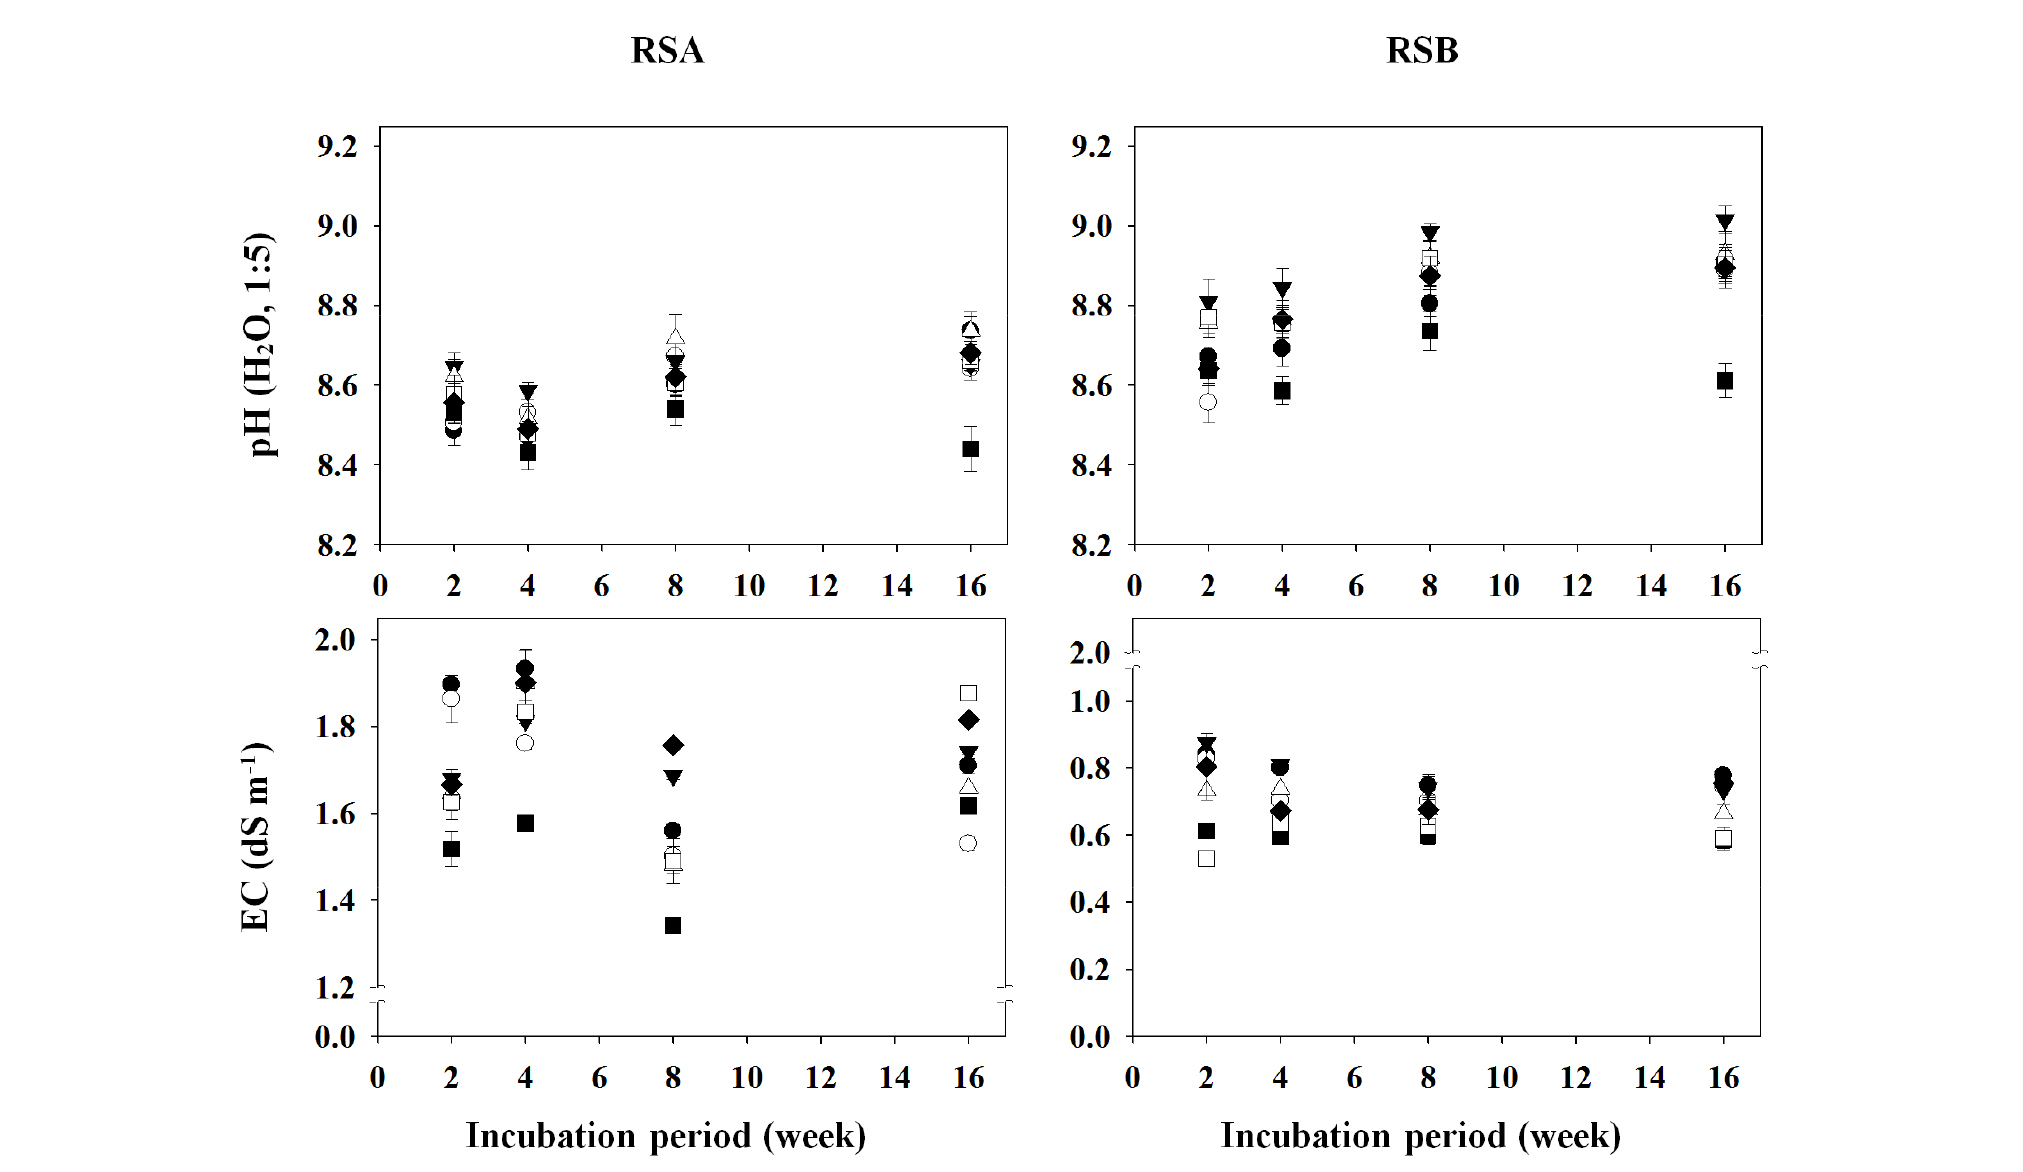
Fig. 2.
Changes in pH and electrical conductivity (EC) values of the different remediated soils as affected by the applications of different organic amendments during the period of 16-week incubation.
†RSA, remediated soil A previously contaminated with petroleum hydrocarbons; RSB, remediated soil B previously contaminated with petroleum hydrocarbons.
‡◆, Control; □, BC1; ■, BC5; △, CC1; ▼, CC5; ○, LC1; ●, LC5.
§ Control, no treated; BC1, 1% of biochar treated; BC5, 5% of biochar treated; CC1, 1% of charcoal treated; CC5, 5% of charcoal treated; LC1, 1% of livestock manure compost treated; LC5, 5% of livestock manure compost treated.
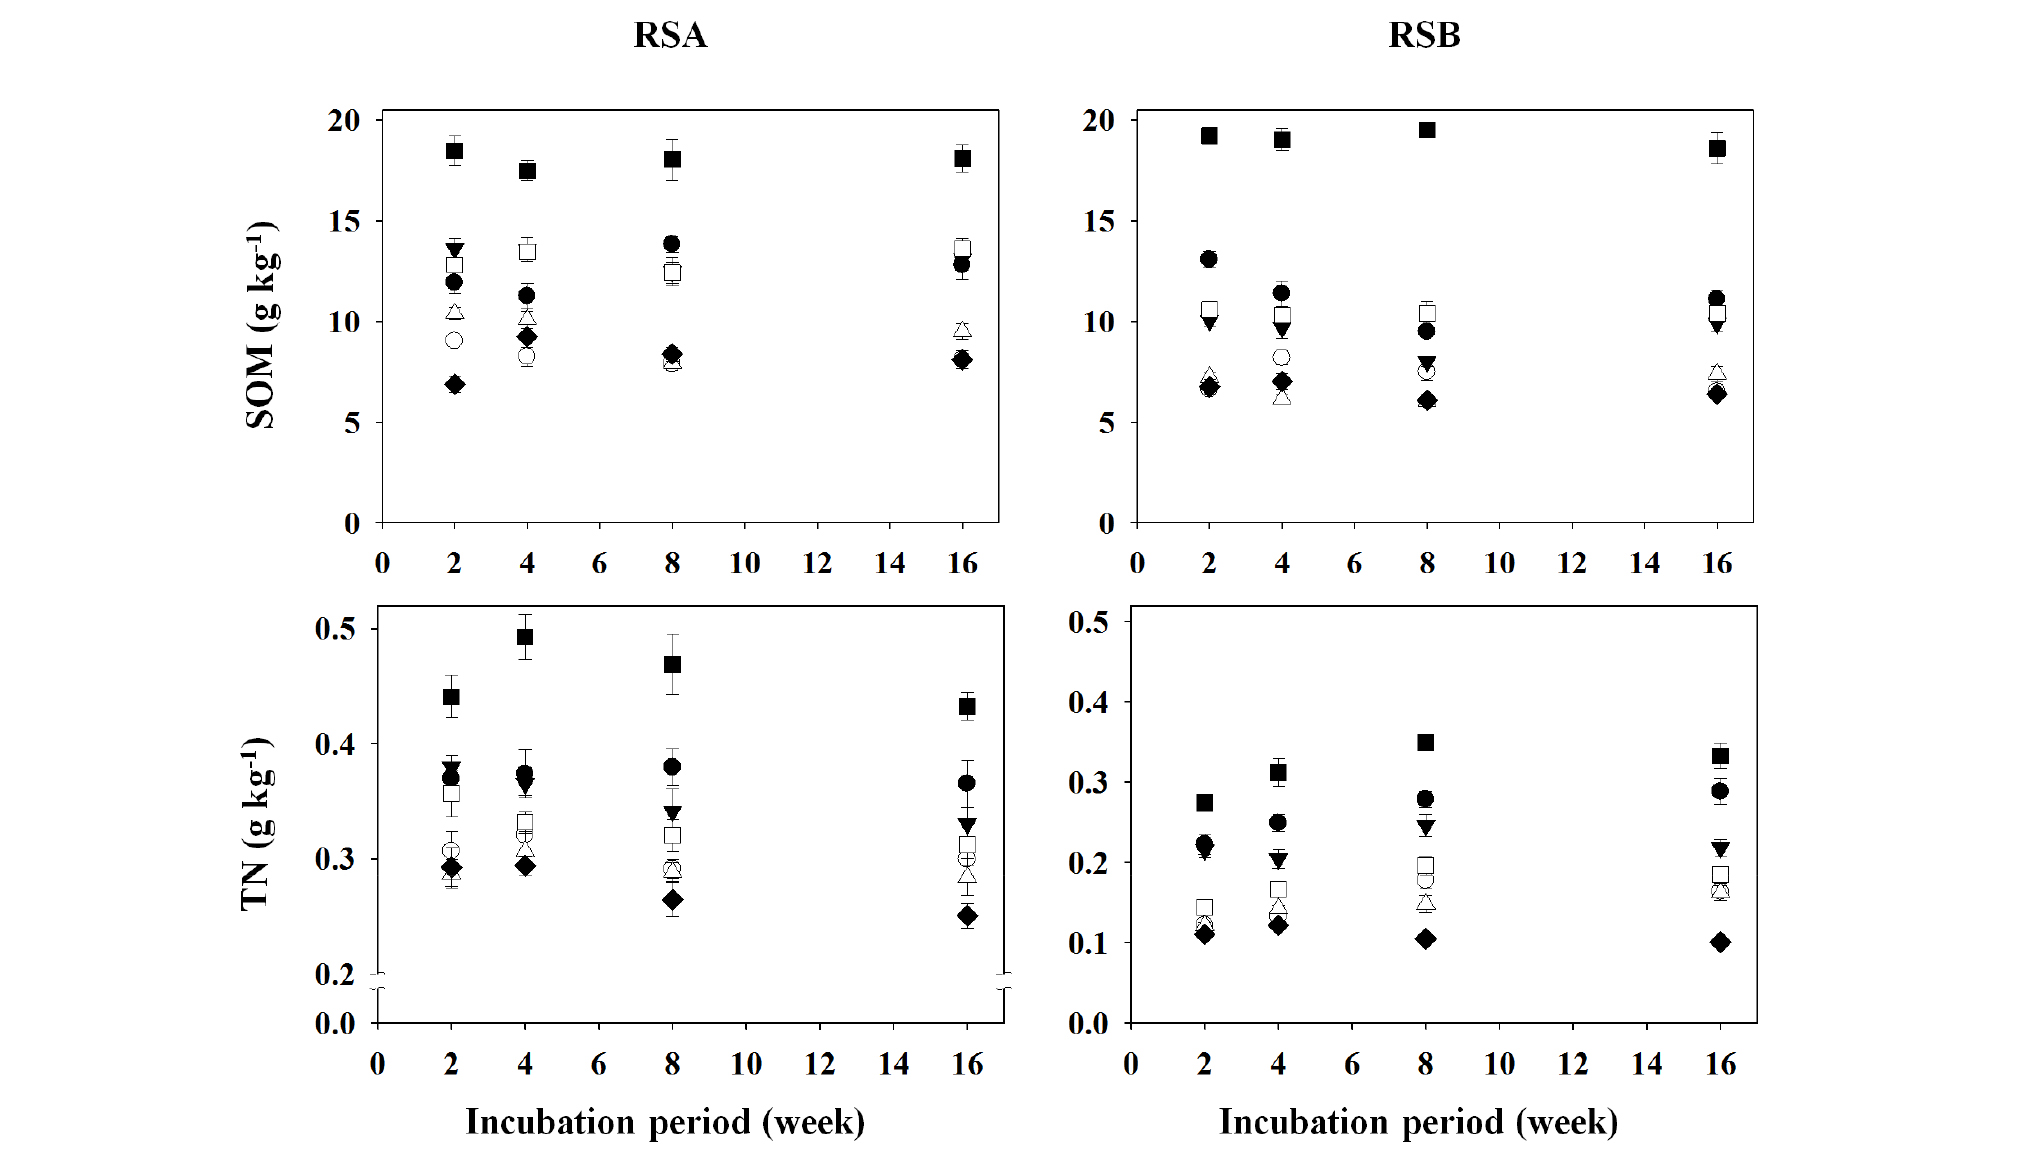
Fig. 3.
Changes in soil organic matter (SOM) and total nitrogen (TN) values of the different remediated soils as affected by the applications of different organic amendments during the period of 16-week incubation.
†RSA, remediated soil A previously contaminated with petroleum hydrocarbons; RSB, remediated soil B previously contaminated with petroleum hydrocarbons.
‡◆, Control; □, BC1; ■, BC5; △, CC1; ▼, CC5; ○, LC1; ●, LC5.
§ Control, no treated; BC1, 1% of biochar treated; BC5, 5% of biochar treated; CC1, 1% of charcoal treated; CC5, 5% of charcoal treated; LC1, 1% of livestock manure compost treated; LC5, 5% of livestock manure compost treated.
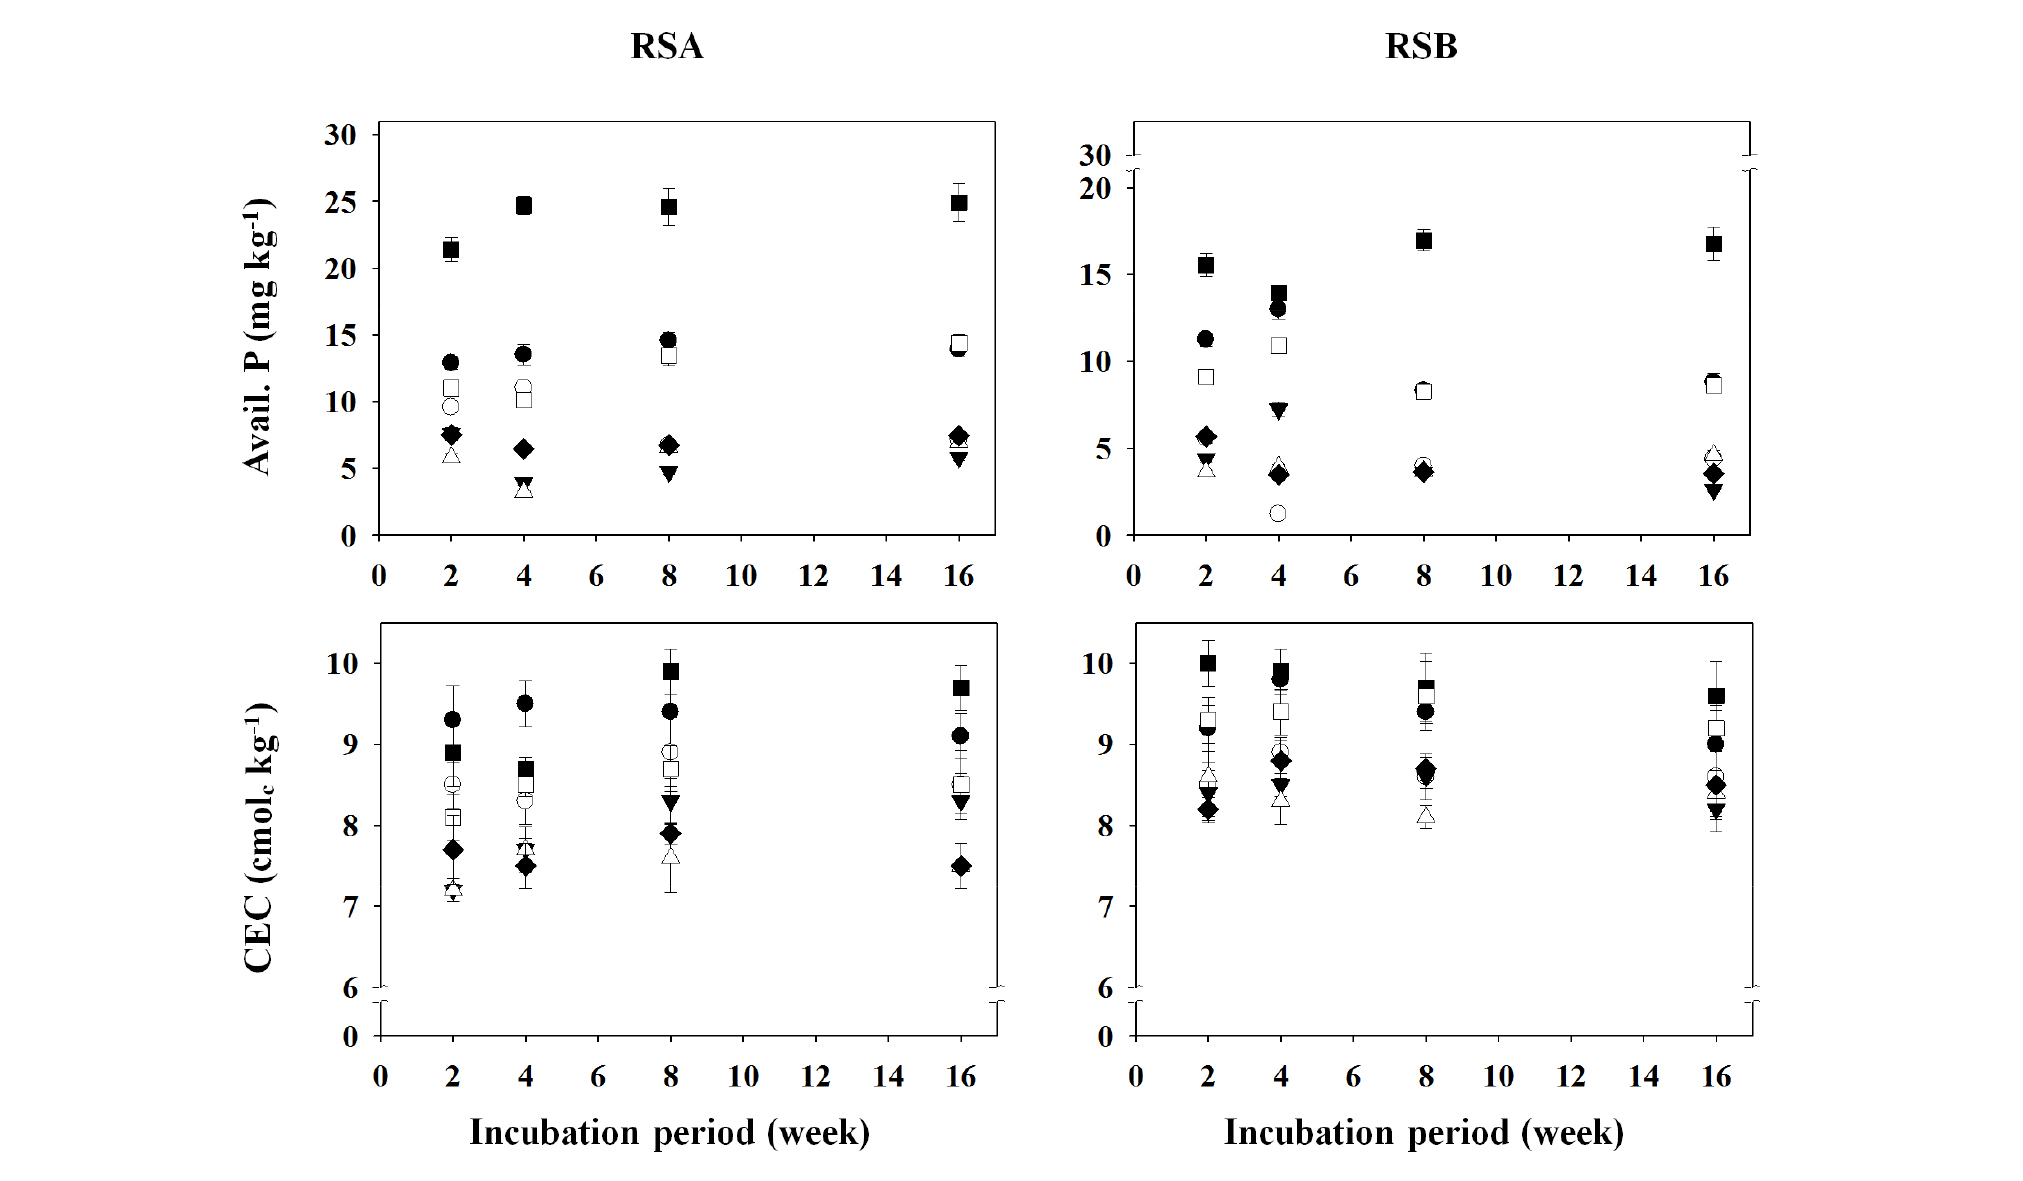
Fig. 4.
Changes in available phosphorus (as P2O5) and cation exchange capacity (CEC) values of the different remediated soils as affected by the applications of different organic amendments during the period of 16-week incubation.
†RSA, remediated soil A previously contaminated with petroleum hydrocarbons; RSB, remediated soil B previously contaminated with petroleum hydrocarbons.
‡◆, Control; □, BC1; ■, BC5; △, CC1; ▼, CC5; ○, LC1; ●, LC5.
§ Control, no treated; BC1, 1% of biochar treated; BC5, 5% of biochar treated; CC1, 1% of charcoal treated; CC5, 5% of charcoal treated; LC1, 1% of livestock manure compost treated; LC5, 5% of livestock manure compost treated.
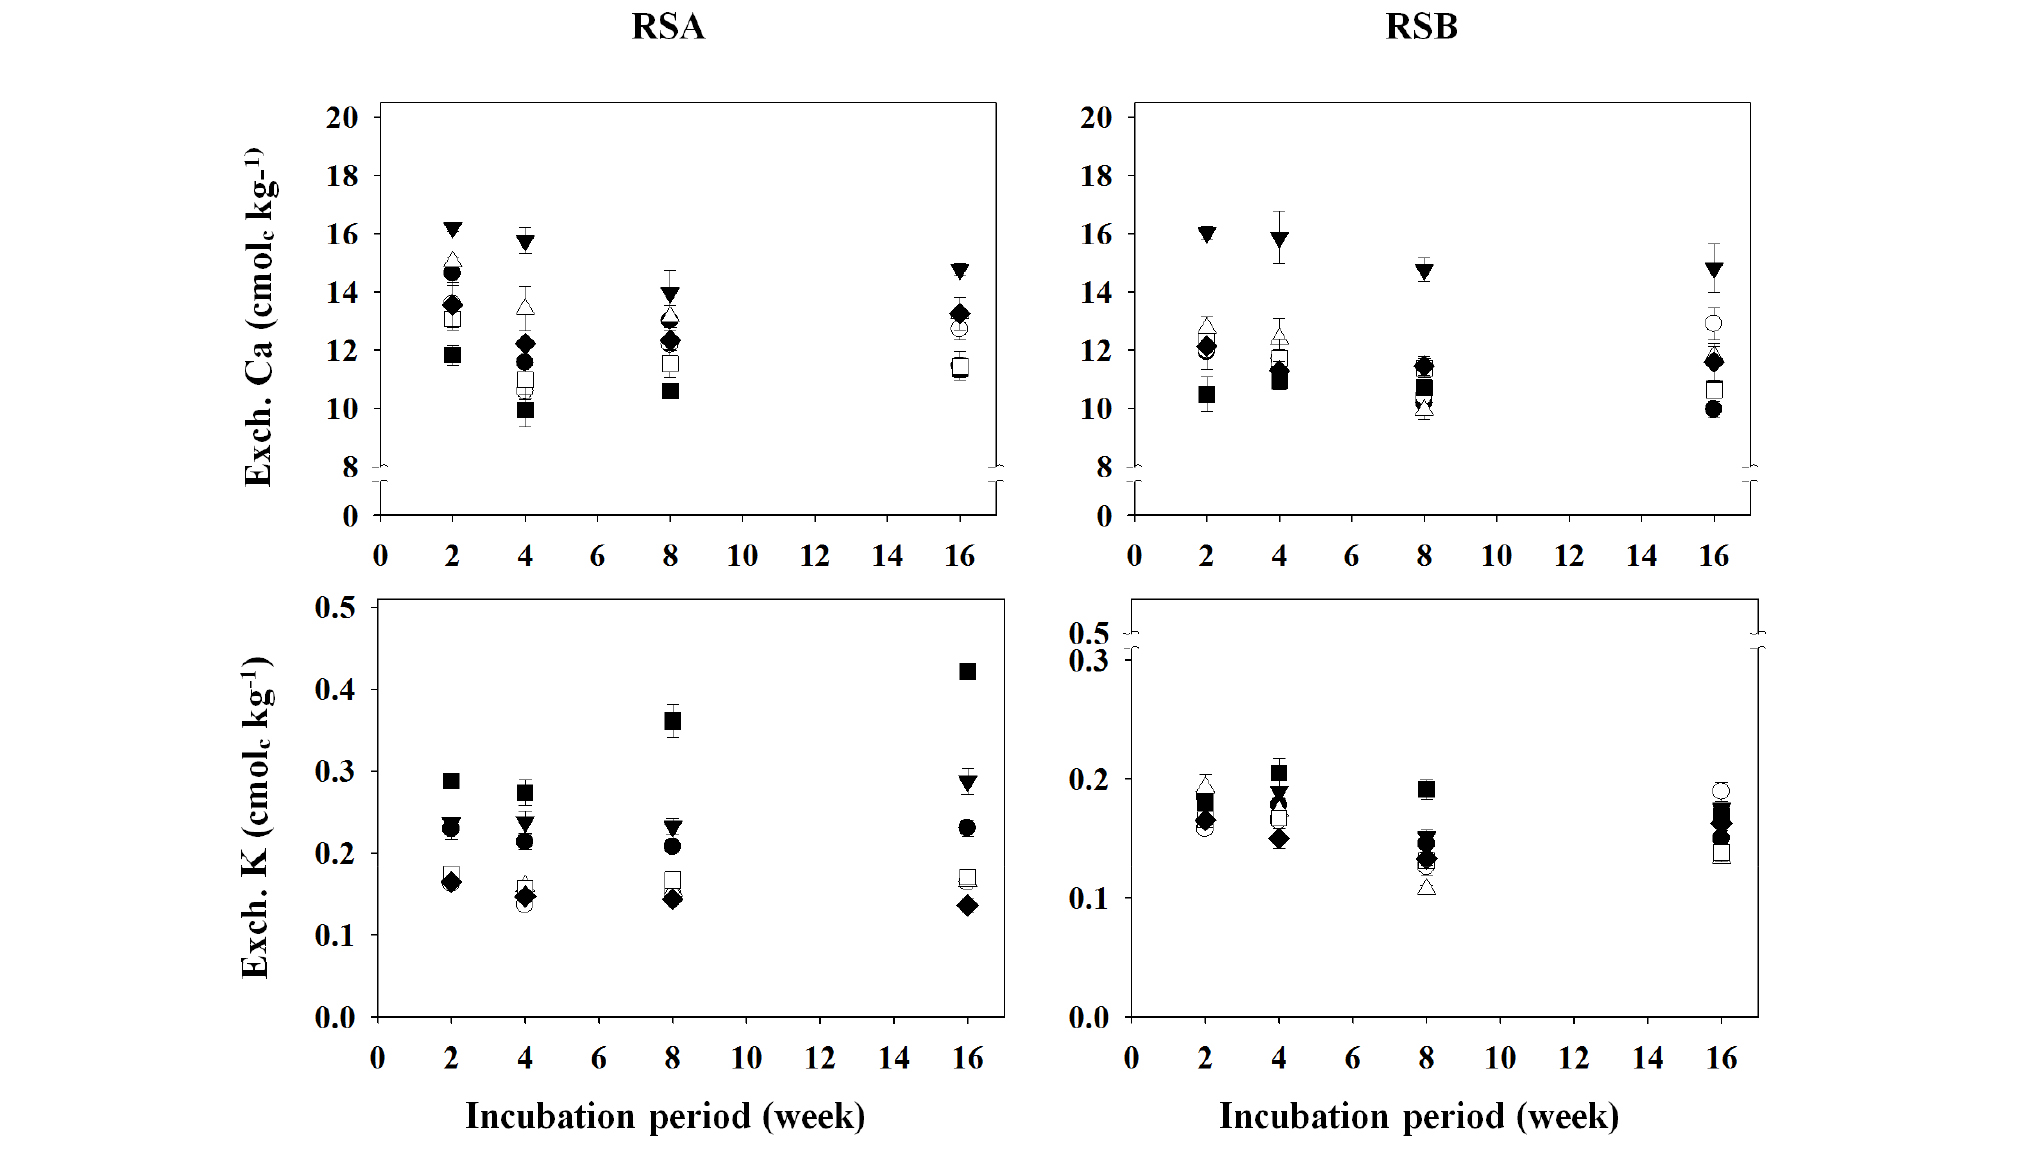
Fig. 5.
Changes in exchangeable cation (Ca and K) concentrations of the different remediated soils as affected by the applications of different organic amendments during the period of 16-week incubation.
†RSA, remediated soil A previously contaminated with petroleum hydrocarbons; RSB, remediated soil B previously contaminated with petroleum hydrocarbons.
‡◆, Control; □, BC1; ■, BC5; △, CC1; ▼, CC5; ○, LC1; ●, LC5.
§ Control, no treated; BC1, 1% of biochar treated; BC5, 5% of biochar treated; CC1, 1% of charcoal treated; CC5, 5% of charcoal treated; LC1, 1% of livestoc/manure compost treated; LC5, 5% of livestock manure compost treated.
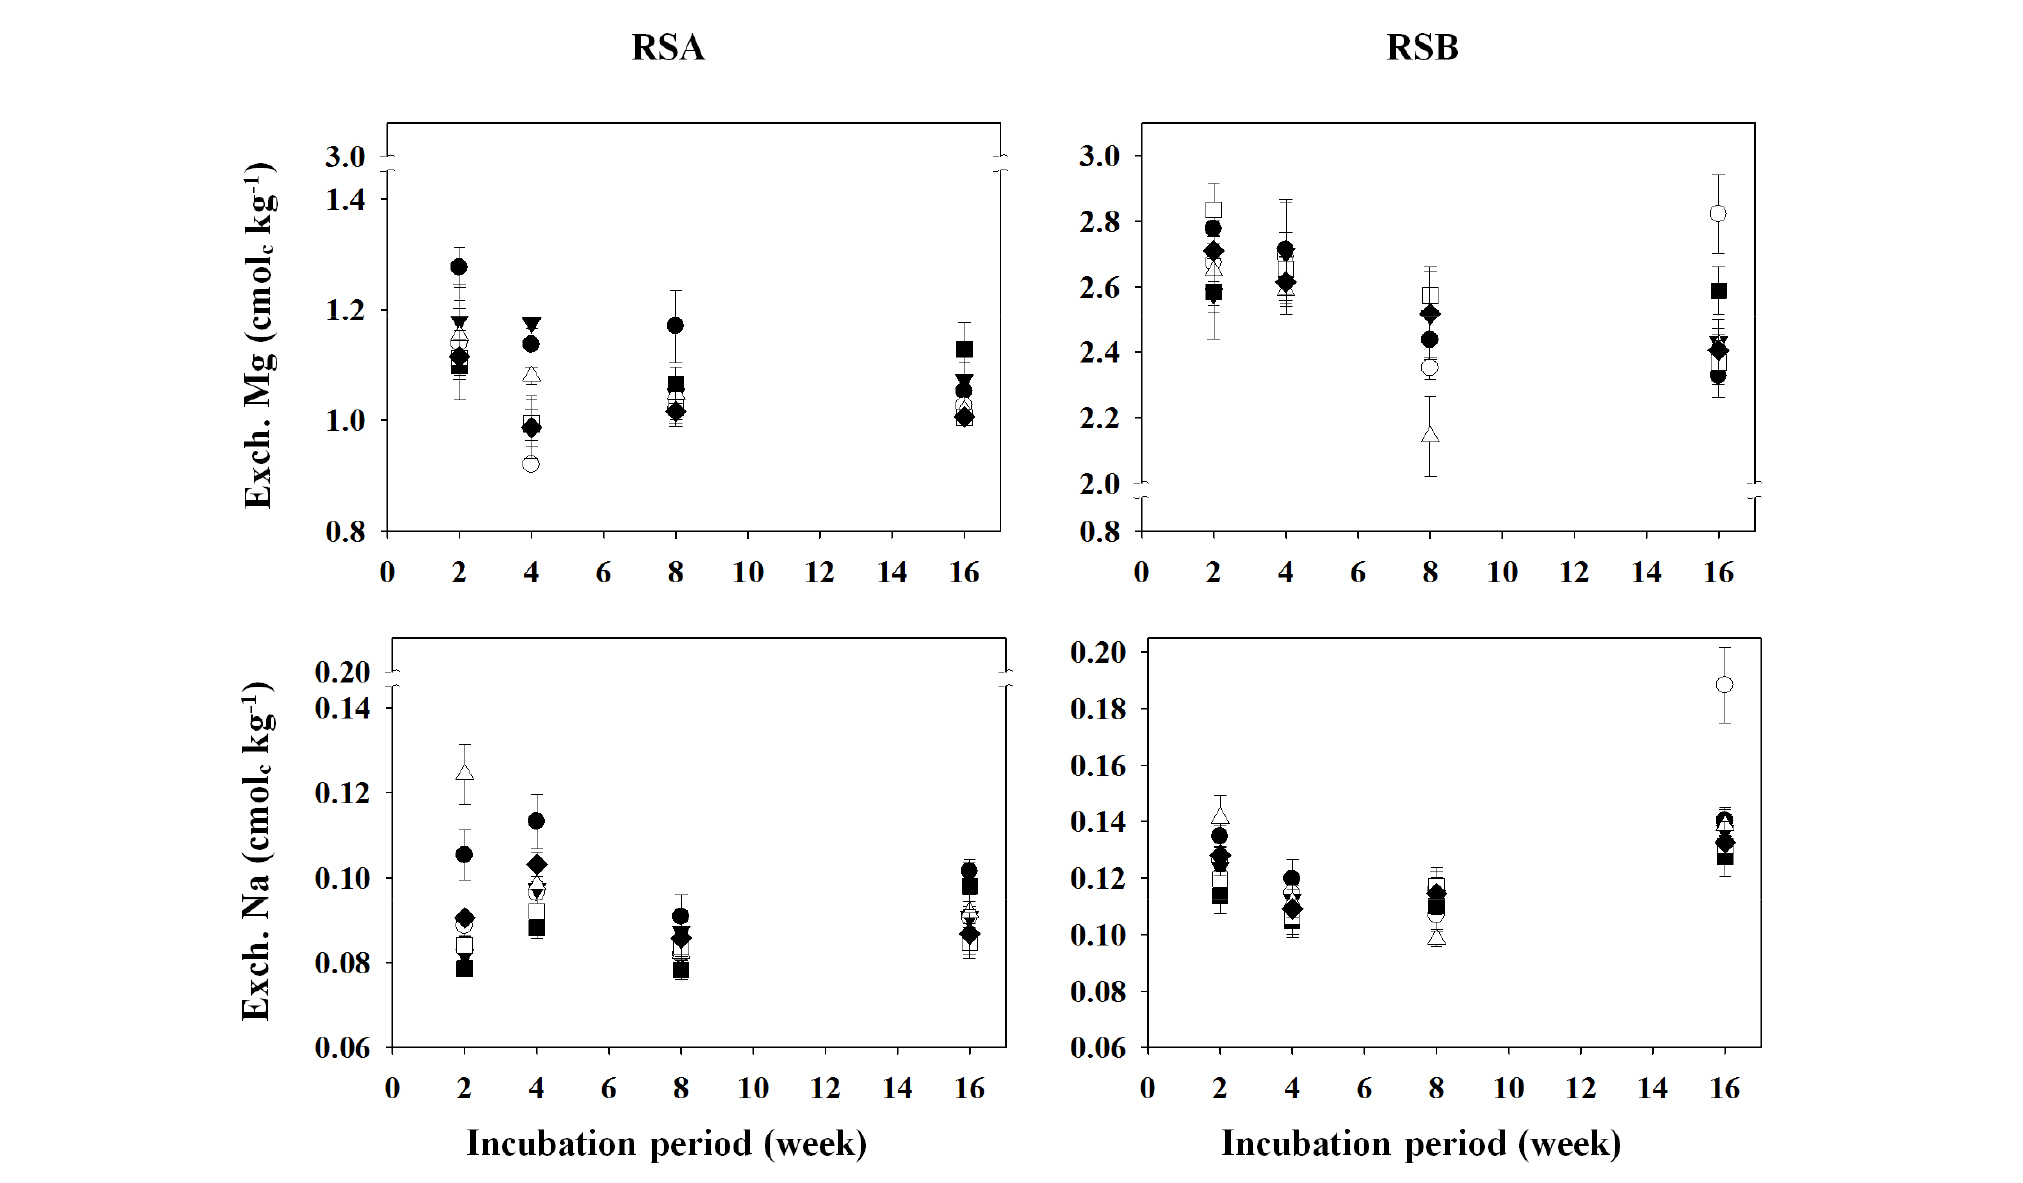
Fig. 6.
Changes in exchangeable cation (Mg and Na) concentrations of the different remediated soils as affected by the applications of different organic amendments during the period of 16-week incubation.
†RSA, remediated soil A previously contaminated with petroleum hydrocarbons; RSB, remediated soil B previously contaminated with petroleum hydrocarbons.
‡◆, Control; □, BC1; ■, BC5; △, CC1; ▼, CC5; ○, LC1; ●, LC5.
§ Control, no treated; BC1, 1% of biochar treated; BC5, 5% of biochar treated; CC1, 1% of charcoal treated; CC5, 5% of charcoal treated; LC1, 1% of livestock manure compost treated; LC5, 5% of livestock manure compost treated.
Fig. 2 shows the changes in soil pH and electrical conductivity (EC) values of the remediated soils, RSA and RSB. There were no specific changes of soil pH values with the treatments of organic amendments during the incubation period. In the pots treated only with 5.0% biochar (BC5), both RSA and RSB showed slight decreases in pH values. It is believed that the soil conditioners did not have a major effect on pH, and any change in pH may be attributed to the buffering mechanism against pH possessed by the soil itself. Ludwig et al. (2001) stated that the reason why pH changes did not occur readily was because of the buffering power of the soil against pH change. The EC values decreased slightly in the BC-treated pots, but there were no distinct changes during the incubation period. The EC of soil conditioner BC, CC, and LC was 0.8 dS m-1, 7.4 dS m-1, and 10.4 dS m-1, respectively. These EC values, especially for LC and CC, were very high, considering that the appropriate EC for farmland soil in Korea is expected to be lower than 2.0 dS m-1 (Jung et al., 1998).
The changes in soil organic matter (SOM) content, total nitrogen (TN) concentration, available P2O5 concentration, and cation exchange capacity (CEC) value of the different remediated soils, RSA and RSB are presented in Figs. 3 and 4. The contents of SOM did not show significant changes based on incubation period, and the LC5- (treated with 5.0% livestock manure compost), CC5- (treated with 5.0% charcoal), and BC5- (treated with 5.0% biochar) pots all showed increases in SOM content, with the BC5 pots in RSA and RSB showing the largest increases of 18.5 g kg-1 (2-week) and 19.5 g kg-1 (8-week), respectively (Fig. 3). It is believed that increases in SOM content may be attributed to high organic matter content in the soil conditioners used. According to a study by Lee et al. (2012), soil treatments with pig manure and liquid fertilizer did not affect changes in SOM content. In addition, in a study by Jones et al. (2012), biochar increased carbon content in soil, and a study by Arthur et al. (2015) demonstrated a directly proportional correlation between the application amount of biochar and increase in soil organic carbon (SOC) content. The concentration of TN did not show distinct changes, whereas it appeared to be highest in the BC5 pots. It is known from a study by Hwang et al. (2002) that livestock compost had an effect on increasing nitrate nitrogen content in soil, whereas studies by Mankasingh et al. (2011) and Jones et al. (2012) showed that biochar treatment did not affect nitrogen content in soil, which were in contrast to the findings from this study. It is believed that TN concentration in the remediated soils used in this study was much lower than that of normal farmland soil, and thus, treatment with LC, CC, and BC had some effects. There were no changes in available phosphorus (as P2O5) concentration during the incubation period, in the BC5 pots of RSA and RSB showing the highest contents of 24.9 mg kg-1 (16-week) and 17.0 mg kg-1 (8-week), respectively (Fig. 4). However, these values were much lower than the recommended available phosphorus concentration for common crops in Korea (NAAS, 2010a). Studies by Hwang et al. (2002) and Yun et al. (2009) demonstrated that livestock manure composts were effective in increasing available phosphorus concentration in soil. However, the CC-teated pots showed no differences or decreased the available phosphorus concentration compared with the control pots. This was likely due to reduced solubility from phosphate ions (HPO42- and H2PO4-1) and Ca fixation in soil with high pH (Raven and Hossner, 1993; Lee and Doolittle, 2004). The CEC values did not show distinct changes during the incubation period, and in the BC5 pot, RSA and RSB showed the highest increases of 9.9 cmolc kg-1 (8-week) and 10.0 cmolc kg-1 (2-week), respectively (Fig. 4). It is believed that this was due to the high organic matter content in the BC5 pots. It indicates that SOM or organic carbon content is known to be associated with CEC (63Sombroek et al., 1993; Liang et al., 2006).
The concentrations of exchangeable cations (Ca, K, Mg, and Na) in the different remediated soils, RSA and RSB are shown in Figs 5 and 6. The concentrations of exchangeable cations (Ca, K, Mg, and Na) did not show distinct changes during the incubation period; however the exchangeable cation concentrations in the remediated soils, RSA and RSB, were influenced by the applications of different organic amendments. The exchangeable Ca concentration was high in the CC-treated pots of RSA and RSB. In particular, a large increase in exchangeable Ca was observed in the CC5 pots, whereas the BC5 pots showed a reduction of Ca compared to Control pots (Fig. 5). These results should be caused from much higher Ca concentration (16.98 g kg-1) in CC conditioner than that in LC and BC conditioners (Table 2). Landfarming remediation technique stimulates the activities of aerobic microbes by providing them with a contiguous supply of moisture, air, and nutrients, which in turn, facilitates the degradation of organic pollutants, such as petroleum (Khan et al., 2004; McCarthy et al., 2004; Pal et al., 2010; Jain et al., 2011), where the optimal pH range for biodegradation is 6.5-7.5 (Khan et al., 2004). Moreover, pH must be in the range 6.0-9.0 in order to reach an optimal state for microbial growth and degradation, and also sufficient amounts of nutrients and oxygen must be supplied to achieve optimal microbial metabolism (Das and Chandran, 2010). During this process, soil is treated with lime or Ca to neutralize the soil pH (Jain et al., 2011). It is believed that the exchangeable Ca concentration in the remediated soil was high due to the large amount of Ca used to neutralize the soil pH, and as a source of nutrient for microbial growth. In addition, Ca is known to increase flocculation of soil colloid (Rengasamy, 1983; Rengasamy et al., 1986; Heil and Sposito, 1993; Curtin et al., 1994; Dontsova and Norton, 2002), and when an adequate amount of Ca is added, it can induce soil aggregation; however, an unnecessarily high concentration may have a negative effect on soil hardness. On the order hand, in the different pots of RSA and RSB, exchangeable K increased with BC treatments, especially in BC5 pots of RSA, but exchangeable Ca decreased with them (Fig. 5). Tyler and Olsson (2001) reported that when the effects of soil pH on the ion concentrations within soil solution were examined, K and Ca showed contrasting solubility characteristics. The exchangeable Mg concentration increased in LC5 pots of RSA, whereas the other amendments did not show any specific trend in both the RSA and RSB pots. In addition, the exchangeable Na concentration showed no significant difference in both the soils with the organic amendments during the incubation period (Fig. 6).
Correlations of soil properties
The correlations between soil properties were analyzed based on changes in remediated soil properties according to the treatment of organic soil conditioners, the results of which are shown in Table 4. Soil pH was found to have significantly high negative correlations with EC, SOM, TN, available phosphorus, and exchangeable K (p < 0.01) and significantly high positive correlations with exchangeable Mg and exchangeable Na (p < 0.01). The value of EC was found to have significantly positive correlations with TN (p < 0.01), exchangeable K (p < 0.05), and exchangeable Ca (p < 0.05) and significantly high negative correlations with exchangeable Mg, exchangeable Na, and CEC (p < 0.01). SOM content was found to have significantly high positive correlations with TN, available phosphorus, exchangeable K, and CEC (p < 0.01). The concentration of TN was also found to have high significant positive correlations with available phosphorus and exchangeable K (p < 0.01) and significantly high negative correlations with exchangeable Mg and exchangeable Na (p < 0.01). Likewise, available phosphorus concentration was found to have significantly high positive correlations with exchangeable K and CEC (p < 0.01), a significantly high negative correlation with exchangeable Ca (p < 0.01), and significantly negative correlations with exchangeable Mg and exchangeable Na (p < 0.05). Exchangeable K was found to have a significantly negative correlation with exchangeable Mg (p < 0.05) and a significantly positive correlation with CEC (p < 0.05). Exchangeable Ca showed a positive correlation with CEC (p < 0.01). Exchangeable Mg also showed significantly high positive correlations with exchangeable Na and CEC (p < 0.01).
Table 4. The values of correlation coefficient (r) among the various chemical properties of the remediated soils as affected by the applications of different organic amendments (n = 56).
‡Correlation coefficient (r) was determined by Pearson correlation analysis to evaluate the relationship between parameters. Result were evaluated with 95% and 99% confidence intervals; *, significant at p < 0.05, and **, significant at p < 0.01 level.
In regard to low available phosphorus concentration being found in the CC-treated plots that showed high exchangeable Ca content in the analysis of soil properties, and even in this correlation analysis, available phosphorus and exchangeable Ca were highly negatively correlated with each other (p < 0.01). Moreover, CEC appeared to be high based on SOM content being high in the BC-treated pots. The correlation analysis also showed a significantly high positive correlation between CEC and SOM content (p < 0.01). SQI and SQIW were strongly positively correlated with SOM (p < 0.01). A study by Kim et al. (2015) on soil fertility distribution in paddy fields reported a significantly high positive correlation between SOM content and CEC. In addition, Ahn et al. (2012) reported that available phosphorus and soil pH had a negative correlation with each other, and the present study also found a negative correlation between available phosphorus and soil pH.
Soil quality assessment
Soil quality assessment is very important for identifying the improvement effects on remediated soil properties after treatment with soil conditioners, and it is necessary to quantify the results of such soil quality assessment into numeric values. Accordingly, in the present study, the score of soil quality indicator rating for Korean soils proposed by Yoon et al. (2004) was used to calculate SQI and SQIw. The results showed that treatment with soil conditioners had specific effects on improving soil quality. In particular, the BC5 plots showed the highest SQI scores (mean 56.0 for RSA and mean 54.5 for RSB), which were similar to SQIw scores (Table 5). However, the soil quality was relatively very poor as compared to the soil quality indicator rating (Table 3). The SQI score for Korean paddy soils in 2003 (1,970 samples) was 96, whereas the SQI score for Korean upland soils in 2001 (1,510 samples) was 91 (Yoon et al., 2004). In a survey of long-term variations in Korean paddy fields quality by Kim et al. (2010), the SQI scores for 1995, 1999, 2003, and 2007 were 90, 93, 96, and 96, respectively. As compared to these values, the quality of remediated soil was much lower. However, treatment with soil conditioners was shown to have a positive effect on soil quality improvement, and thus long-term systematic management is expected to produce good outcomes.
Table 5. Soil quality index (SQI) of the different remediated soils as affected by the applications of different organic amendments.
‡Control, no treated; BC1, 1% of biochar treated; BC5, 5% of biochar treated; CC1, 1% of charcoal treated; CC5, 5% of charcoal treated; LC1, 1% of livestock manure compost treated; LC5, 5% of livestock manure compost treated.
§SQI = sum of each soil quality indicator score / number of soil properties selected
¶SQIW (weight additive soil quality index) = [sum (each soil quality indicator score × weight value)] / [sum (each weight value)]
∮Mean = [sum (each period of SQI or SQIW)] / (number of periods)
∫Numbers followed by the different letter within a column of mean∮ are significantly different at p < 0.05 by Duncan's multiple range test.
Conclusion
We investigated the changes in properties and quality of selected remediated soils, RSA and RSB, previously contaminated with different concentrations of TPH, as affected by the applications of different organic amendments as soil conditioners including BC, CC, and LC. The remediated soil samples still contained certain concentrations of TPH residuals even after remediation by the landfarming technique. However, the TPH residuals in RSA and RSB at room temperature (24 ± 2°C) were degraded by 50% or more of the initial concentrations during the incubation periods of 10-12 weeks. The properties of RSA and RSB were influenced by the treatments of different organic amendments. SOM content of RSA and RSB in BC5 pot increased up to 18.5 g kg-1 and 19.5 g kg-1, respectively. Also, the available phosphorus concentrations as P2O5 of the remediated soils in the BC5 pots increased up to 24.9 mg kg-1. However, the concentration of exchangeable Ca decreased in both the RSA and RSB with BC5 treatment. In particular, The concentration of available phosphorus showed significantly negative correlations with soil pH (p < 0.01) and exchangeable Ca concentration (p < 0.01), which indicates that the availability of phosphate is found to decrease in high soil pH by fixation of phosphate ions with calcium ions. On the order hand, the improvement of soil quality for RSA and RSB was evaluated using soil quality indices (SQIs). The BC5 plots showed the highest SQI scores (mean 56.0 for RSA and mean 54.5 for RSB), which means that a proper amount of biochar application leads an outstanding improvement of soil quality for similar types of remediated soils.
