


Introduction
Materials and Methods
Study site description
Initial physico-chemical characteristics of the soil before experimental set-up
Treatments and experimental designs
Cropping system management and agronomic practices
Field monitoring and data collection methods
Runoff and soil loss measurements
Cover management factors
Statistical data analysis
Results and Discussion
Relationships between soil loss and raifall intensity/amount
Relationship between soil loss reduction rate, soil loss, percent soil cover and rainfall parameters
Correlation between soil loss, percent soil coverage and measured rainfall parameters
Cover management factor
Conclusions
Introduction
About 80% of Korea’s highlands are distributed in the Gangwon State Government at an altitude of more than 800 m above sea level (Jung et al., 2004; Kim et al., 2020). The steeply nature of the land in the region favours rapid water erosion and large soil losses which reduces crop productivity (Lee et al., 2013). Though soil erosion leading to soil loss is a natural phenomenon, intricately dependent on natural factors such as rainfall intensity, duration and amount, slope gradients and length, soil texture, soil organic matter and soil hydraulic properties, anthropogenic factors such as tillage and soil covers could control it in managed cropping systems (Ochoa et al., 2016; Zhang et al., 2017). Soil loss carries productive topsoil off site, leading to a decline in soil fertility, effective rooting depth and crop productivity. The soil is offloaded downslope into water bodies, polluting them and causing serious environmental problems like eutrophication and increased turbidity of running water (Joo and Lee, 2011; Molla and Sisheber, 2017). For example, in the upper stream area of the Soyang River Basin in Gangwon State Government region, heavy rains in the summer growing season of 2006, that caused excessive erosion and soil loss, and increased the turbidity of running water from 3.1 Nephelometric Turbidity Units (NTU) to 55.8 NTU for more than 9 months (Gangwon-do ARES, 2008). Thus, controlling soil loss has the potential to reduce the environmental problems and increase crop productivity.
Relatively lower temperatures experienced all year round in the Gangwon State Government region allows for the cultivation of temperate crops such as Kimchi cabbage (KC), potatoes and radishes (Hong et al., 2018), with KC as the major crop of the highlands. In recent times, where climate change causes more severe, frequent and unpredictable rainfall events, the problem of soil loss due to water erosion and its resultant decline in the productivity of the above-mentioned crops, is aggravated (Lee et al., 2013; Bak and Lee, 2021). Slope gradients of almost half of the highlands are above 15% (Sung et al., 2020); as a result, soil loss in the region is reported at 80 tons ha-1 yr-1 compared to the country’s average of 34.5 tons ha-1 yr-1 (Jung et al., 2004; Bak and Lee, 2021; Kang et al., 2021). The growing season in the region lasts for three months after which harvest spans from August to October. Due to the nature of the growing season, the soil is left bare for a long period post-harvest until the next growing season. Gangwon State Government receives about 10% of the total annual precipitation (1,417.9 mm yr-1) of the entire country (www.kma.go.kr; 07/12/2023); and on average, no month ever lacks a rainy day (www.worlddata.info/asia/south-korea/climate-Gangwon State Government-php; 07/12/2023). Rainfall events leads to soil losses which should be managed. Thus best management practices (BMP’s) for the soil should focus on soil cover during on and off-seasons.
Among various measures to reduce soil loss, vegetative soil cover such as planting cover crops, spontaneous vegetation, crop residue mulch and straw mulch during the fallow period has proved to be effective ways around the world (Kaye and Quemada, 2017). In Pyeongchang, Korea, Bak and Lee (2021) reduced soil loss by 98% (compared to bare soil) by cultivating Alfalfa in the off-season in a maize cropping system. Ryu et al. (2010) observed between 56 to 75% reduction in soil loss following the cultivation of rye and hairy vetch in the fallow period, in a KC cropping system in a Highland experimental farm. Compared to the control, they also observed 2-times increase in the yield of KC that followed hairy vetch cultivation and incorporation. Vegetative soil cover intercepts rain drops, retards their speed at the soil surface, reduces the detachment of soil particles, increases infiltration rate and reduces runoff velocity which causes soil loss (Huffman et al., 2013). The effectiveness of a vegetation cover depends largely on these factors: type of vegetation, and percentage ground cover (Sumiahadi et al., 2019). A lot of research have found soil vegetative cover important in reducing soil losses (Zhang et al., 2003; Zuazo and Pleguezuelo, 2008; Ruiz-Colmenero et al., 2013). It is important to estimate soil losses during the growth and post-harvest of the major crops in the highlands region to contribute to inventories that serve as decision support tools for soil conservation management in the region. KC cropping systems are considered in our study. In this study, soil losses were estimated under ranges of slope steepness common to the highlands, natural rainfall amounts and intensities and percent soil coverage by KC from June 2021 to May 2023.

Materials and Methods
Study site description
The experiments were conducted at the slope lysimeter experimental set up section of the Highland Agriculture Research Institute in Daegwallyeong, Pyeonchang-gun, Gangwon-do (37°40'48.0''N, 128°43'51.0''E). The lysimeters (Fig. 1) are structures built to measure soil loss in accordance with standards provided by the universal soil loss equation (USLE), deduced by the U.S. Department of Agriculture (USDA). The lysimeters were filled with saprolite (soil formed from chemically weathered rock). Fig. 1 is a picture of the lysimeter set-up and an enlarged view of the unit that collects runoff water from the set-up.
The slope simulation areas measure 2.8 m in width by 22.4 m in length. The steepness of the slopes of the lysimeters have been created at 2, 7 and 15% to allow for appropriate comparison between a range of steepness of flatlands to that common to the highlands. The area receives annual precipitation amounts of about 140 mm yr-1 (www.kma.go.kr; 07/12/2023).
Initial physico-chemical characteristics of the soil before experimental set-up
Six soil samples were collected randomly with an auger at 15 cm depth from each slope lysimeter set-ups, for physico-chemical characterization before the start of the experiments (plant debris at the top 1 cm of the soil were slashed off to prevent overestimation of soil parameters). The samples were put together and thoroughly mixed to form composites before analysis. Table 1 shows the soil properties before the start of the experiments in the 2021/2022 experimental year.
All soil parameters were analysed using the standard analysis methods of the National Institute of Agricultural Sciences (NAAS, 2011). Soil texture (particle size distribution) was determined by the hydrometer method. Soil pH was determined with a pH meter, at a soil to distilled water ratio of 1:5. Soil carbon concentrations were determined with an elemental analyser (Orion Versa Star, Thermo, USA) and then converted to soil organic matter values by multiplying it by a factor of 1.75. Soil available phosphorus concentration was calorimetrically quantified at 720 nm wavelength with the UV-VIS spectrophotometer (Lambda 365, Perkin Elmer, USA). Exchangeable cations (Ca, K, Mg and Na) in the soil were extracted with 1 N mono-ammonium acetate and measured with inductively coupled plasma (ICP, Optima 2100DV, Perkin Elmer, USA).
Before treatment applications, soil texture in all slope lysimeters was sandy loam. Soil pH in all lysimeters ranged from 6.6 - 6.8, slightly above the optimum range of 6.0 - 6.5 for KC cultivation (NIAS, 2022). Soil organic matter (SOM) was low in the 7% slope lysimeter but within optimum levels (25 - 35 g kg-1; NIAS, 2022) in the 2 and 15% slope lysimeters. Available phosphorus pentoxide (Av. P2O5) concentrations ranged from 164 to 317 mg kg-1, which were below the recommended 350 - 450 mg kg-1 for KC cultivation (NIAS, 2022). Soil Ca, K, and Mg concentrations in all three slope lysimeters were above, below, and within the optimum range recommendation by NIAS (2022; 5.0 - 6.0 cmolc kg-1, 0.65 - 0.80 cmolc kg-1, 1.5 - 2.0 cmolc kg-1), respectively.
Table 1.
Initial physico-chemical properties of the soil before the start of the experiments.
|
Slope steepness | Soil texture | pH (1:5) |
SOM† (g kg-1) |
Av. P2O5‡ (mg kg-1) | Exch. cations (cmolc kg-1) | |||
| Ca | K | Mg | Na | |||||
| 2% | Sandy loam | 6.6 | 27.0 | 164.0 | 9.1 | 0.3 | 1.5 | 0.2 |
| 7% | Sandy loam | 6.8 | 22.0 | 245.0 | 10.5 | 0.3 | 1.7 | 0.2 |
| 15% | Sandy loam | 6.8 | 34.0 | 317.0 | 9.7 | 0.5 | 1.7 | 0.3 |
Treatments and experimental designs
The experiment started in the 2021/2022 experimental year and was repeated in the 2022/2023 experimental year. Treatments considered in the experiments included the cultivation period, the percentage soil coverage during KC cultivation, and steepness of the slopes of the lysimeter. The cultivation period was divided into two, namely: KC cultivation and post-harvest. Post -harvest, cabbage residue was spread on the soil and left to decompose. Volunteer grass succeeded the residue after its decomposition. At each cultivation stage, bare land was also left for comparison to the cover type. As described early on, the slope gradients of the lysimeters were 2, 7 and 15% and each lysimeter measured 2.8 m wide and 22.4 m long.
Cropping system management and agronomic practices
At the beginning of every experimental year, previous vegetation cover was ploughed in the soil (after soil sampling) to prepare the land. The KC standard cultivation method prescribed by the Rural Development Administration (RDA) was followed; thus a planting distance of 70 cm × 35 cm was used. After KC harvest, cabbage residues were spread on the soil surface as mulch and left to decompose. Grass weeds succeeded the residue cover after decomposition. N, P and K fertilizers were applied at rates of 23.8, 3.0 and 7.1 kg ha-1 to KC, in accordance with the standard fertilizer requirements prescribed by RDA. The bare land and KC cultivated land were treated with herbicide before transplanting of KC to control weeds. In order not to confound the effects of the soil cover (i.e. KC) on soil loss, the lysimeters were weeded manually at 30-day intervals after transplanting KC.
Field monitoring and data collection methods
On rainy days, hourly rainfall amounts were calculated using the Atmos 41, ZL6 datalog installed in the runoff collection unit of the lysimeter. Rainfall intensity (EI30 MJ mm ha-1 hr-1) was calculated by the formula suggested by Foster et al. (1981). The number of rainfall events were determined by modifying the method described by Wischmeier and Smith (1978). Wischmeier and Smith (1978) defined a rainfall event as a one-time event if the rainfall amount for 15 minutes was 6.35 mm or more. However, our methodology allowed for only hourly interval measurement, so we did not include the case of 6.35 mm or more for 15 minutes (Ok et al., 2021). Rainfall amounts and intensities received during the experimental periods were shown in Fig. 2.
Relatively, rainfall amounts and intensities received in the 2021/2022 experimental year were lower than those received in the 2022/2023 experimental year. In the first experiment (2021/2022), a total of 270 mm and 650 EI30 MJ mm ha-1 hr-1 rainfall amounts and intensities respectively, were received during KC cultivation. A total of 304 mm rainfall amounts and 358 EI30 MJ mm ha-1 hr-1 rainfall intensities were received post-harvest. Whereas in the second experiment (2022/2023), total rainfall amounts and intensities received during KC cultivation were 589 mm and 2,405 EI30 MJ mm ha-1 hr-1 respectively. Total rainfall amounts and intensities received post-harvest in the second experiment were 540 mm and 869 EI30 MJ mm ha-1 hr-1 respectively.
The percentage of soil covered by KC (termed as ‘percent soil coverage’) in the lysimeter was measured by applying the method described by Lee and Won (2012). It was done from the time of cabbage seedling transplant to harvest, every day after every rainfall event. During the analysis, representative points were selected from each test sphere. Point angles (50 cm width × 50 cm length) were fixed at the same point each time. The soil coverage rate of the growing cabbage, cabbage residue or grass cover were determined with an Image Wayne Rusband (US), from photos taken at a height of 1 m.
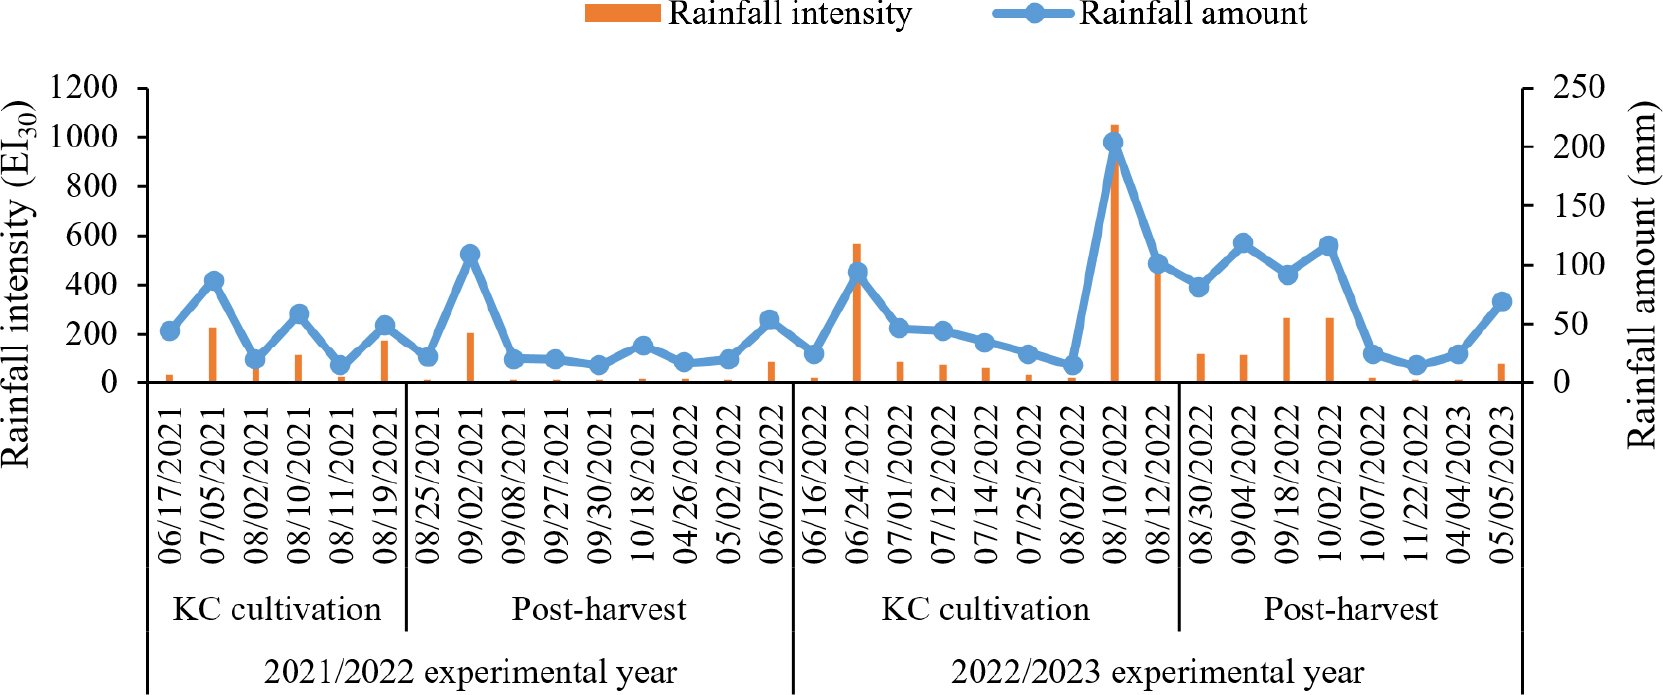
Fig. 2.
Rainfall amounts and intensities on various rainy days in the 2021/2022 and 2022/2023 experimental years. Experimental years have been grouped into periods of KC growth and after harvest. Line graph represents the amount of rainfall (mm) received in rainfall events on rainy days. Bar graphs represent the intensities (EI30 MJ mm ha-1 hr-1) of the rainfall amounts received on those days.
Runoff and soil loss measurements
A 300 L collection tank installed in the water collection unit of the lysimeter was used to collect runoff and to measure soil loss. The runoff water mixed with eroded soil passed through the splitter, which collects water and soil in the ratio of 1 to 100. The splitter automatically rotates by gravitational force. The amount of water and soil collected were determined after every rainfall event.
Cover management factors
Cover management factors of each soil cover in a cultivation period or in a post-harvest period was calculated by the Eq. 1 (adapted from NIAST, 2012).
where, ∑ means summation, Aci is the soil loss from the plant/residue cover on a certain date, Ai is the soil loss under the bare soil on that same date, and n is the number of times soil loss measurements were taken under the cultivation period.
Statistical data analysis
Collected data sets were subjected to regression and correlation analysis using Microsoft excel. Datasets for the two experimental years were put together for the regression analysis. Soil loss was regressed on rainfall intensity and amounts to determine the relationships between them, using data points from the two experimental years. Percent soil loss reduction rate was regressed on percent soil covered by KC. Correlation coefficients between soil loss, percent soil coverage and measured rainfall parameters were also determined.
Percent soil loss reduction rate was calculated by the Eq. 2.
Results and Discussion
Relationships between soil loss and raifall intensity/amount
In the two experimental years (2021/2022 and 2022/2023), the magnitude of soil loss under bare land and KC cultivation ranged from 0 to 2.689 tons ha-1 in the 2% slope lysimeters; 0 - 13.817 tons ha-1 in the 7% slope lysimeters and 0 - 85.595 tons ha-1 in the 15% slope lysimeters (Fig. 3).
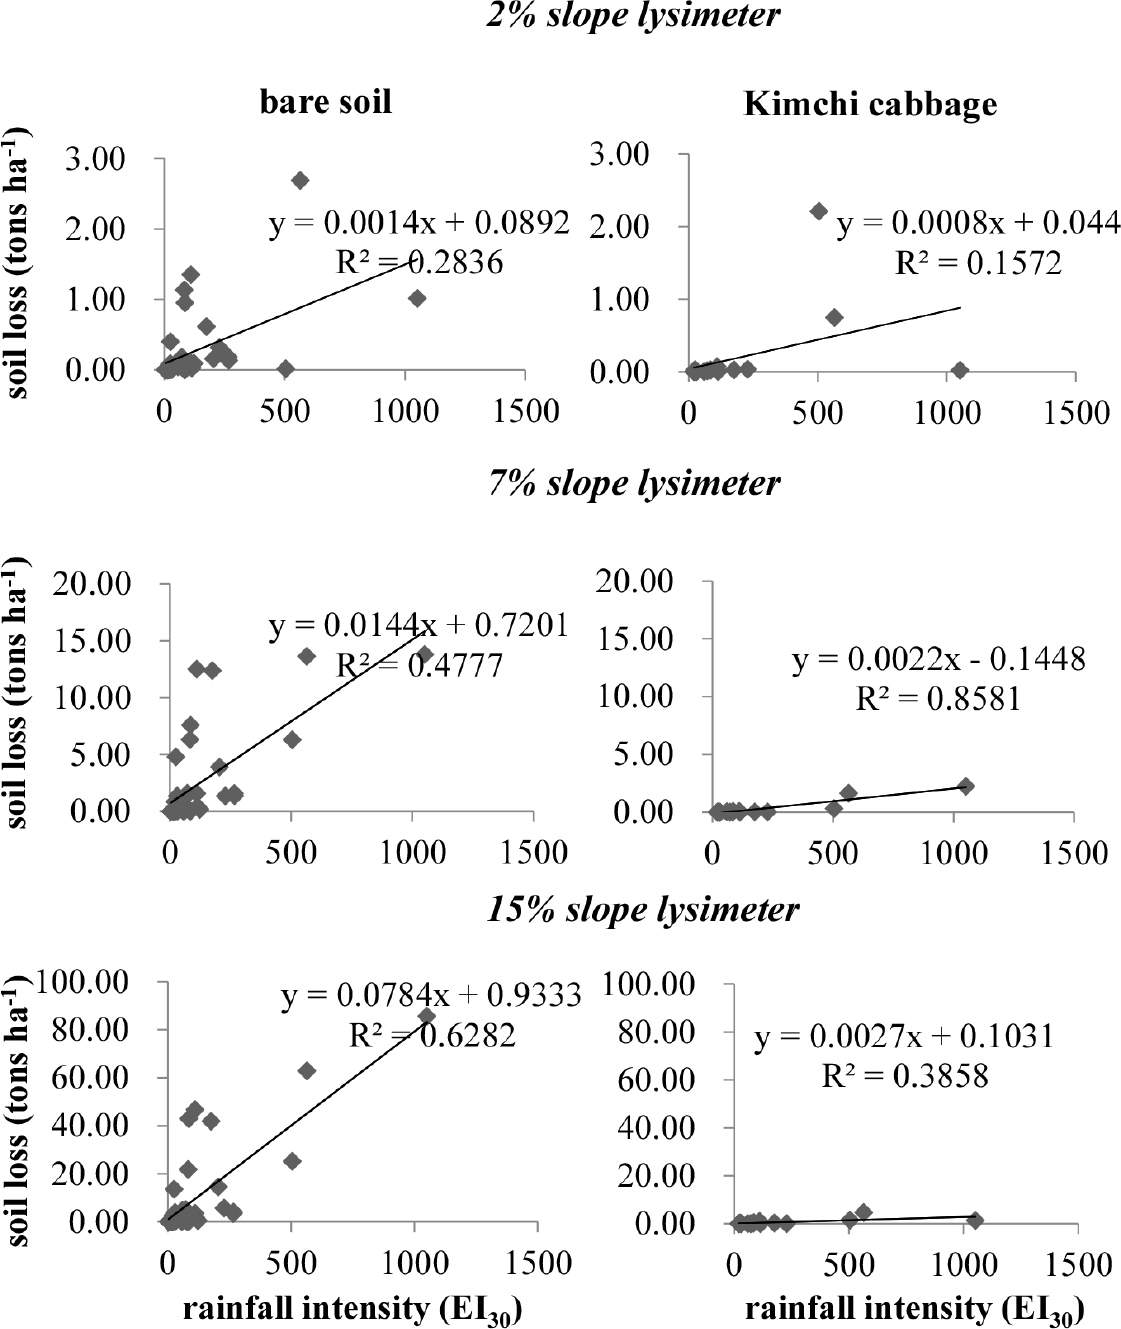
Fig. 3.
Relationship between soil loss and rainfall intensity during KC cultivation period and on bare soil. Data points are soil loss data for the two experimental years. Trendlines represent equations (y = mx + c) of the lines of fit of the data set. A positive slope (m) of the equation indicates that soil loss increases as rainfall intensity. The coefficient of determination (R2) informs about the goodness of fit of the equations. The more R2 approaches 1, the more the line of fit perfectly represents the data set. P-value ≤ 0.05 means the line of fit (equation/model) is significant, while an equation with p-value > 0.05 is not significant.
In the bare land, soil loss increased with increase in rainfall intensity in all three slope lysimeters (Fig. 3). Rainfall intensity significantly (p ≤ 0.05) predicted 28% of the variation in soil losses in the 2% slope, 48% of the variation in soil losses in the 7% slope and 63% of the variation in soil losses in the 15% slope (Fig. 3). Soil loss in the 2% slope under KC cultivation was not significantly (p > 0.05) contributed to by rainfall intensity (Fig. 3). However, rainfall intensity significantly (p ≤ 0.05) predicted 86% to the variations in soil losses in the 7% slope and 39% in the 15% slope lysimeters (Fig. 3). Under both slope lysimeters (7 and 15%), increasing rainfall intensities increased soil losses.
Slope gradient of a land is an important control on soil erosion and resultant soil loss. Higher magnitude of soil losses on steeper slopes than the 2% was the effect of gravity on runoff velocity, as gravity has been reported to enhance runoff velocities and soil losses on steeper slopes than gentle slopes (Khan et al., 2016; Singh, 2018; Jourgholami et al., 2021). Other studies have had varied results on the effect of slope steepness on soil erosion and soil loss (Defersha et al., 2011; Siswanto and Sule, 2019; Zheng et al., 2019), however, conclusions drawn from them indicate that effective slope steepness that presents a positive linear relationship between slope and soil loss ranges from 8 - 25%. Beyond this range, the relationship varies depending on soil quality parameter, rainfall intensity and plant density among others.
Increase in soil loss with increasing rainfall intensity in most of the slope lysimeters was expected because highly intensive rainfall has higher potential to detach soil; and also cause sealing of soil pores leading to poor infiltration and increased runoff velocities that carry soil offsite (Khan et al., 2016; Al-Kaisi et al., 2023). Rainfall intensity did not contribute significantly to soil loss in the 2% slope lysimeters under KC cultivation, but it did under the bare land, suggesting that leaving the soil bare definitely causes significant soil losses in such cropping systems, irrespective of the slope gradient of the land, and as such should be avoided.
Higher magnitude of soil losses in the bare land compared to the KC covered lands in the 7 and 15% slope lysimeters supports reports that vegetation covers intercept rainfall, reduce runoff velocities and detachment energy and prolong infiltration time (Zuazo and Pleguezuelo, 2008), leading to about 97% lower soil losses observed. Duan et al. (2022) also observed 98% reduction in soil loss with vegetation cover compared to bare land. The morphology and root system of vegetative covers may also create a soil bunding effect, which serves as barrier to soil transport (Bissonnais et al., 2004). There is a strong indication that KC provides some soil conservation benefits in these highland regions.
Similarly, soil loss on the bare land positively correlated with rainfall amount in all three slope lysimeters (Fig. 4). Rainfall amount significantly (p ≤ 0.05) predicted 11% of the variation in soil loss in the 2% slope, 25% in the 7% slope and 33% in the 15% slope lysimeters (Fig. 4). Under KC cultivation, rainfall amount did not contribute significantly (p > 0.05) to the varitaions in soil loss under 2% slope lysimeters. However, rainfall amount contributed 72% to soil losses in the 7% slope. There was no significant change (p > 0.05) in soil loss with increasing rainfall amounts in the 15% slope lysimters under KC cultivation (Fig. 4).
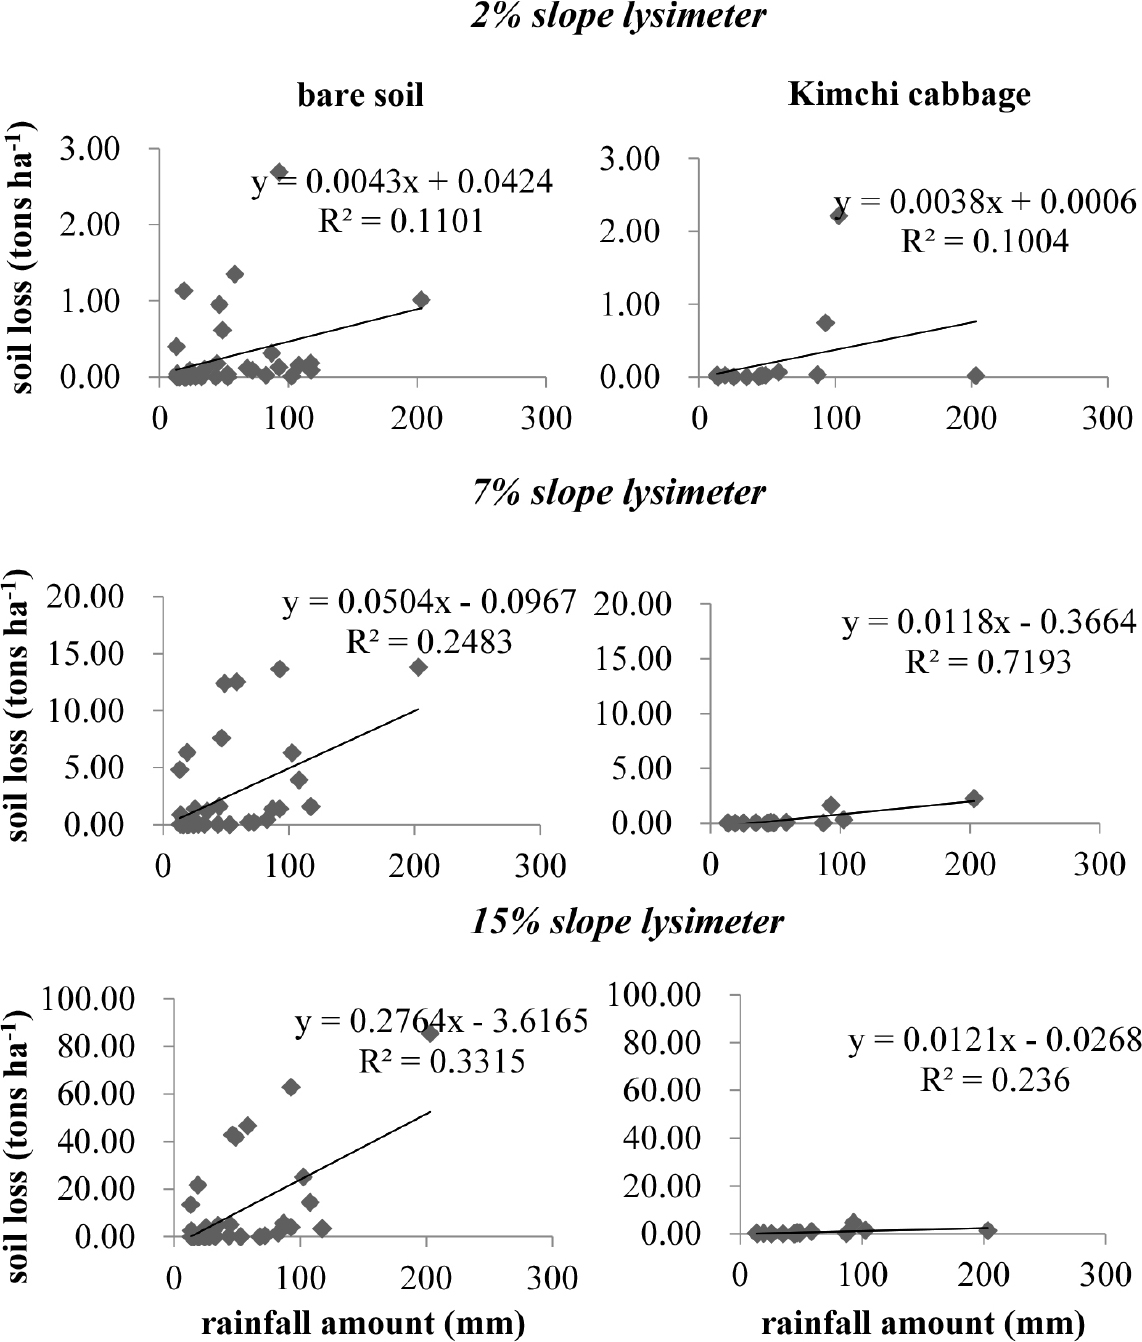
Fig. 4.
Relationship between soil loss and rainfall amount during KC cultivation period and on bare soil. Data points are soil loss data for the two experimental years. Trendlines represent equations (y = mx + c) of the lines of fit of the data set. A positive slope (m) of the equation indicates that soil loss increases as rainfall amount increases. The coefficient of determination (R2) informs about the goodness of fit of the equations. The more R2 approaches 1, the more the line of fit perfectly represents the data set. P-value ≤ 0.05 means the line of fit (equation/model) is significant, while an equation with p-value > 0.05 is not significant.
Positive relationship between rainfall amount and soil loss in many of the slope lysimeters has to do with the soil’s infiltation capacity. Once soil pores are completely saturated with rain, the excesses overflow as runoff, carrying along detached soil particles. Runoff volume and velocities that directly affect soil loss are thus directly related with the amount of rainfall received (Zambon et al., 2020; Zhang et al., 2022). Again soil losses were minimal under KC cultivation compared to bare lands in all three slope lysimeters because KC biomass intercepted rainfall, reduced raindrop energy, increased water infiltration time and reduced runoff velocities (Feng et al., 2020).
Relationship between soil loss reduction rate, soil loss, percent soil cover and rainfall parameters
Under KC cultivation, increasing percent soil coverage by the KC heads corresponded to increases in the soil loss reduction rates (Fig. 5). In the 2% and 15% slope lysimeters, percent soil coverage significantly (p ≤ 0.05) contributed 41% and 50% to soil loss reduction rate, while there was no change in soil loss reduction rate with increasing percent soil coverage in the 7% slope lysimeters (Fig. 5).
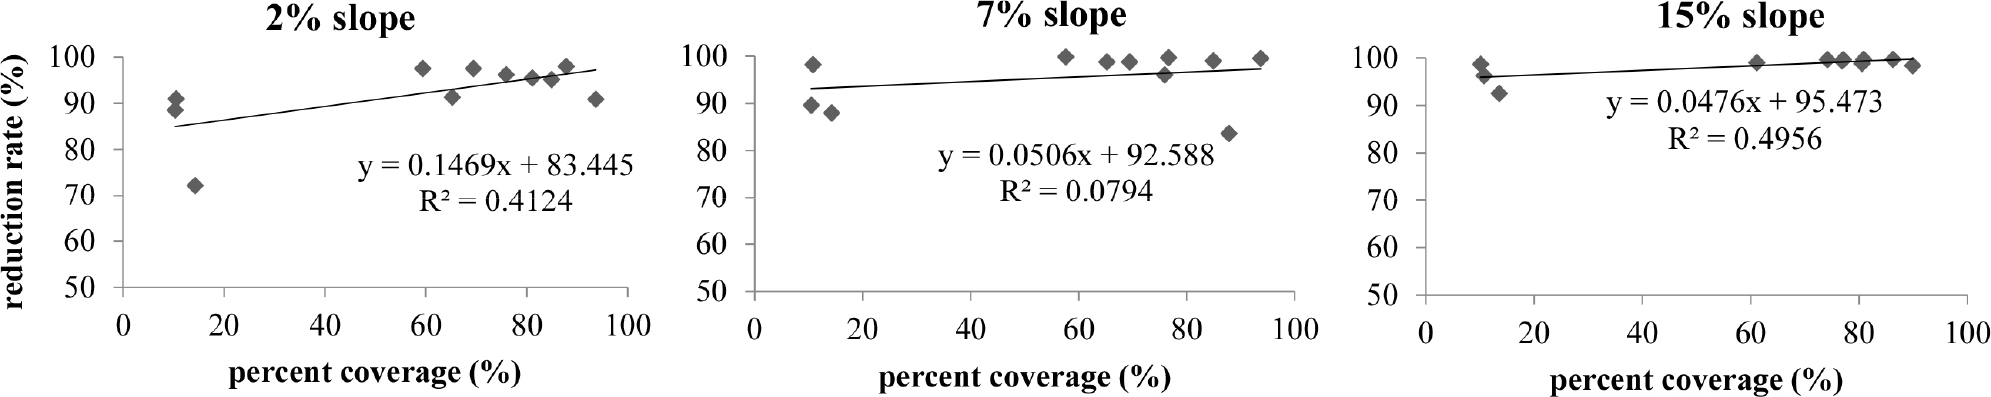
Fig. 5.
Relationship between soil loss reduction rate and percentage soil coverage by cabbage heads during KC cultivation. Data points are soil loss data for the two experimental years. Trendlines represent equations (y = mx + c) of the lines of fit of the data set. A positive slope (m) of the equation indicates that soil loss increases as percent soil coverage increases. The coefficient of determination (R2) informs about the goodness of fit of the equations. The more R2 approaches 1, the more the line of fit perfectly represents the data set. P-value ≤ 0.05 means the line of fit (equation/model) is significant, while an equation with p-value > 0.05 is not significant.
Correlation between soil loss, percent soil coverage and measured rainfall parameters
The amount of rainfall received during the experimental years correlated strongly and positively with soil loss in the 7 and 15% slope lysimeters (Table 2). The same was observed with rainfall intensity under the 7 and 15% slope lysimeters (Table 2). However, relationships between percent soil coverage in the slope lysimeters and soil losses in the same lysimeters, were predominantly weak and negative (Table 2).
Table 2.
Correation between soil loss and soil loss predictors.
|
Rainfall amount |
Rainfall intensity |
Coverage 2% |
Coverage 7% |
Coverage 15% |
Soil loss 2% |
Soil loss 7% |
Soil loss 15% | |
| Rainfall amount (mm) | 1† | |||||||
| Rainfall intensity | 0.92 | 1 | ||||||
| Coverage 2% | -0.042 | 0.084 | 1 | |||||
| Coverage 7% | -0.003 | 0.10 | 0.93 | 1 | ||||
| Coverage 15% | 0.028 | 0.11 | 0.93 | 0.93 | 1 | |||
| Soil loss 2% | 0.23 | 0.40 | -0.20 | -0.18 | -0.21 | 1 | ||
| Soil loss 7% | 0.82 | 0.97 | 0.081 | 0.085 | 0.089 | 0.55 | 1 | |
| Soil loss 15% | 0.46 | 0.64 | -0.16 | -0.14 | -0.15 | 0.94 | 0.76 | 1 |
Soil loss reduction rate indicates the percentage of soil retained when a cover is employed, as compared to the bare land. A higher reduction rate is a positive sign that soil loss was minimal under the set of management conditions. Percent soil coverage is the percentage of the soil covered by the vegetation or soil cover in question. Under KC cultivation, increasing percent soil coverage correlated with increases in reduction rate in the slope lysimeters because soil loss was decreased. Increases in percent soil coverage imples that raindrop energy and runoff velocities were being reduced, leading to low soil losses (Zuazo and Pleguezuelo, 2008). Previous research suggested that percent ground cover was a more important factor for soil loss reduction than the type of vegetation (Ade et al., 2019). Though our study confirmed the importance of percent soil cover in reducing soil loss (thus increasing soil loss reduction rate), there were some indications that rainfall intensities and amounts (Figs. 3 and 4) were stronger predictors of soil loss than percent soil coverage under the circumstances of the study. This was confirmed by the stronger positive correlations R2 > 0.5 between rainfall intensity and soil loss (Table 2) compared to the inconsistent weak positive and negative correlations between percent soil cover and soil loss in all three slope lysimeters.
Cover management factor
Cover management factors (C factor) were estimated for KC cultivation period and post-harvest in each slope lysimeter in both experimental years. After the harvest, the land was covered with cabbage residues, which decomposed, and was later succeeded with volunteer grass before the next growing season.
In the 2021/2022 experimental year, KC had C factors of 0.05, 0.005 and 0.01 in the 2, 7 and 15% slope lysimeters, while the post-harvest covers had C factors of 0.16, 0.01 and 0.008 in the 2, 7 and 15% slope lysimeters respectively (Table 3).
Table 3.
Soil loss and C factors in 2021/2022 experimental year.
| Slope | Period | Dates of rainfall events |
Soil loss in bare soil (tons ha-1) |
Soil loss in Kimchi cabbage (tons ha-1) | C factor | |
| 2% |
During KC† cultivation | 06/17/2021 | 0.004 | 0.006 | 0.05 | |
| 07/05/2021 | 0.316 | 0.036 | ||||
| 08/02/2021 | 1.133 | 0.028 | ||||
| 08/10/2021 | 1.351 | 0.072 | ||||
| 08/11/2021 | 0.401 | 0.031 | ||||
| 08/19/2021 | 0.616 | 0.028 | ||||
| Post-harvest | 08/25/2021 | 0.001 | 0.000 | 0.16 | ||
| 09/02/2021 | 0.159 | 0.028 | ||||
| 09/08/2021 | 0.000 | 0.000 | ||||
| 09/27/2021 | 0.002 | 0.000 | ||||
| 09/30/2021 | 0.003 | 0.000 | ||||
| 10/18/2021 | 0.003 | 0.000 | ||||
| 04/26/2022 | 0.000 | 0.000 | ||||
| 05/02/2022 | 0.004 | 0.000 | ||||
| 06/07/2022 | 0.000 | 0.000 | ||||
| 7% |
During KC cultivation | 06/17/2021 | 0.011 | 0.014 | 0.005 | |
| 07/05/2021 | 1.368 | 0.025 | ||||
| 08/02/2021 | 6.325 | 0.008 | ||||
| 08/10/2021 | 12.522 | 0.086 | ||||
| 08/11/2021 | 4.807 | 0.026 | ||||
| 08/19/2021 | 12.391 | 0.038 | ||||
| Post-harvest | 08/25/2021 | 0.046 | 0.000 | 0.01 | ||
| 09/02/2021 | 3.912 | 0.044 | ||||
| 09/08/2021 | 0.013 | 0.000 | ||||
| 09/27/2021 | 0.051 | 0.003 | ||||
| 09/30/2021 | 0.025 | 0.000 | ||||
| 10/18/2021 | 0.007 | 0.000 | ||||
| 04/26/2022 | 0.000 | 0.000 | ||||
| 05/02/2022 | 0.002 | 0.000 | ||||
| 06/07/2022 | 0.000 | 0.000 | ||||
| 15% |
During KC cultivation | 06/17/2021 | 0.246 | 0.007 | 0.01 | |
| 07/05/2021 | 5.718 | 0.076 | ||||
| 08/02/2021 | 21.817 | 0.217 | ||||
| 08/10/2021 | 46.732 | 0.990 | ||||
| 08/11/2021 | 13.559 | 0.285 | ||||
| 08/19/2021 | 41.934 | 0.259 | ||||
| Post-harvest | 08/25/2021 | 0.387 | 0.000 | 0.008 | ||
| 09/02/2021 | 14.544 | 0.113 | ||||
| 09/08/2021 | 0.014 | 0.000 | ||||
| 09/27/2021 | 0.318 | 0.001 | ||||
| 09/30/2021 | 0.055 | 0.000 | ||||
| 10/18/2021 | 0.024 | 0.002 | ||||
| 04/26/2022 | 0.000 | 0.000 | ||||
| 05/02/2022 | 0.010 | 0.002 | ||||
| 06/07/2022 | 0.000 | 0.000 | ||||
In the 2022/2023 experimental year, KC had C factors of 0.59, 0.09 and 0.04 in the 2, 7 and 15% slope lysimeters respectively; while the post-harvest covers had C factors 1.00, 0.06 and 0.10 in the 2, 7 and 15% slope lysimeters respectively (Table 4). Soil losses accompanying rainfall events on 10/02/2022 and 10/07/2022 were quantified together, due to peculiar time constraints, as shown in Table 4.
Cover management factor is a ratio between 0 and 1, 0 ≤ x ≤ 1, where 0 is a factor for soil loss under a 100% effective soil cover and 1 is a factor for soil loss on bare land (Panagos et al., 2015; https://esdac.jrc.ec.europa.eu/themes/cover-management-factor). Thus, if a cover type has a C factor close to 0, for instance 0.01, it is more effective at controlling soil loss than one with a C factor of 0.9. They imply that, the former cover type reduced soil loss by 99% compared to bare land, while the latter cover type reduced soil loss by only 10% compared to bare land. Cover management factors of major upland crops determined by lysimeter experiments by the Soil Conservation Laboratory of NIAST, Korea from 1977 to 2001 were 0.59 for Kimchi cabbage, and 0.44 for maize, soybean 0.19 (Jung et al., 2004). Jung et al. (2004) have discussed that Kimchi cabbage had a high C factor because the coverage was low in rainy season from June to September in their experiment.
Table 4.
Soil loss and C factor in 2022/2023 experimental year.
In the 2021/2022 experimental year, C factors of post-harvest (during cabbage residue cover and grass weed succession) were lower compared to post-harvest C factors in the 2022/2023 experimental year probably because cabbage residue cover decomposed faster and left the soil bare longer before grass succession in the second experimental year. Rainfall amounts were relatively highest at the latter stages of KC growth and post-harvest in the second year (Fig. 2) and it could have accelerated decomposition rates of cabbage residue. Tay and Ratnam (2020) also found that the decomposition of biodegradable soil cover applied in the form of mulch (like the cabbage residue in this study), reduced the performance of the cover in reducing soil losses.
In our study, the C factor of KC reduced (approached 0) as slope gradients increased from 2 to 15% in both experimental years. This suggests that KC was more efficient in reducing soil losses on steeper slopes. Steeper slopes have higher soil loss potential due to accelerated runoff velocities (Siswanto and Sule, 2019; Gastauer et al., 2022), and as such, introduction of a soil cover in such slopes presents more benefits to the system, compared to gentle slopes where soil losses are not as much. The higher average soil organic matter content in the 15% slope lysimeters (Table 1) compared to 2 and 7% slopes may have also contributed to the lower C factors in the 15% slope as higher soil organic matter has been linked with improvement in soil binding properties and soil structure which may lead to reduction in erosion and soil loss compared to bare land (Booth et al., 2005; FAO, 2005).
Conclusions
This study was conducted to evaluate soil losses during and after KC cultivation in the Highland regions of Gangwon. Two repetitive experiments where KC was cultivated were established in 2, 7 and 15% slope lysimeters at the Highland Agriculture Research Institute in 2021/2022 and 2022/2023 experimental years. Post-harvest of KC, residues were spread on the field. They decomposed and were succeeded by volunteer grass in both experimental years.
The study confirmed that steeper slopes influence higher magnitude of soil losses than gentle slopes. It was determined that soil losses increase with increase in rainfall amount and rainfall intensity, however, having KC plants on the land reduced soil losses by up to 97% compared to bare land. Hence growing KC in the highland region is a good soil conservation strategy.
Percentage of the soil covered by KC played a role in soil loss reduction; therefore, maximum plant density should be aimed to conserve the soil. In our study, the contributions of soil loss predictors were as follows: rainfall intensity > rainfall amount > percent soil coverage in both experimental years. Therefore, in KC cropping systems where a 100% soil coverage cannot be ensured, the effect of rainfall intensity and amount should not be marginalized.
Soil losses post-harvest depended largely on rainfall amounts received which directly affected rate of cabbage residue decomposition and the length of time land may be uncovered. It would be a good management practice to purposefully grow cover crops after KC harvest to keep the soil covered during off-season and incorporate it back into the soil to enhance soil fertility.
Cover management factor (C factor) deductions showed that KC was more efficient in reducing soil losses in steeper slopes than gentle slopes, as it reduced higher magnitudes of soil losses in steeper slopes.
