Original research article

Korean Journal of Soil Science and Fertilizer. 31 August 2020. 309-322
https://doi.org/10.7745/KJSSF.2020.53.3.309

ABSTRACT


MAIN

  • Introduction

  • Materials and Methods

  • Results and Discussion

  • Conclusion

Introduction

토양수분은 불포화 토양에 저장된 수분으로 정의되며 (Hillel, 1998; He et al., 2012), 토양에 저장되는 수분은 강수 또는 관개로 부터 공급받고 (Unger and Howell, 2000), 작물은 양분이 용해된 토양수분을 흡수하여 생육하게 된다 (Tinker and Nye, 2000). 강수는 토양에 수분 공급 역할을 하는 주요 인자이고, 강수량과 강수발생 시간의 관계로 계산되는 강수강도 역시 토양침식과 토양수분 침투에 영향을 주는 인자로 고려된다 (Renard et al., 1997; Römkens et al., 2001; Liu et al., 2011). 토양수분은 토양증발, 식물증산, 지표면유출과 같은 수문학적 과정을 제어하는 역할을 하고 (Longobardi, 2008), 기상, 토양온도, 토양특성, 작물피복의 영향을 받는 가변인자이다 (Al-Kayssi et al., 1990; Li et al., 2013; Penna et al., 2013; Yang et al., 2019). 증발과 증산 또한 기상, 토양특성, 식생의 영향을 받게 된다 (Allen et al., 1998, Allen et al., 2011a, Allen et al., 2011b). 토양수분은 농업생산성 측면에서 중요한 의미를 지니고 있으며 기후변화와 가뭄에 대응하기 위하여 농업용수와 토양수분 관리가 중요하게 다루어지고 있다 (Unger and Howell, 2000; Pereira et al., 2002; Hanjra and Qureshi, 2010; Saccon, 2018). 토양수분 함량을 측정하는 방법에는 토양시료를 채취하여 건조하는 건조중량법, 토양입자 표면과 수분의 결합력을 측정하는 텐시오미터법, 전자파 또는 전기저항 변화를 이용하는 센서법 등이 있으며 (Seo et al., 2012), 토양수분센서는 토양수분함량 변화를 실시간으로 측정할 수 있는 장점이 있다 (Kim, 2014). 그리고 토양수분 이동, 증발산, 물수지를 정밀하게 측정하기 위하여 중량식 라이시미터가 이용되고 있다 (Meissner et al., 2010; Meißner et al., 2010; Anapalli et al., 2016; Seo et al., 2016; Kim et al., 2018a; Ok et al., 2018; Kim et al., 2019; Ok et al., 2019). 우리나라의 경우 강우가 여름에 편중되는 특성이 있어 영농이 시작되는 봄철에 가뭄이 우려되기도 한다 (Lee, 2012; Kim et al., 2017, Kim et al., 2018b; Choi et al., 2019). 봄 가뭄 대비를 위해 물관리 계획이 필요하고 물관리 계획을 위해서 비경작기인 겨울과 봄 동안 토양수분 상태 파악이 중요하다. 그리고 토성, 입자분포, 용적밀도 등의 물리적 특성에 따라 토양수분 특성이 달라지게 된다 (Fredlund and Xing, 1994; Tuller and Or, 2004; Song, 2013; Jung et al., 2015, Jung et al., 2016; Seo et al., 2017). 본 시험에서는 논토양을 시험토양으로 선정하였으나, 우리나라의 경우 2모작으로 인한 농경지 재배이용률이 높고 논밭전환이 2014년 25,640 ha, 2015년 20,916 ha, 2016년 22,780 ha, 2017년 33,325 ha, 2018년 18,871 ha로서 해마다 2만 ha 수준을 유지하고 있어 (MAFRA, 2019) 지목 형태보다는 어느 작물이든 재배 가능한 농경지 관점에서 접근하였다. 따라서 본 연구는 토성이 다른 논토양에서 토양 수분 및 온도 측정 센서가 층위별로 매설된 중량식 라이시미터를 이용하여 비경작 기간에 진행되었다. 서로 다른 논토양의 증발산을 비교 평가하였으며, 토양 깊이별 토양수분과 토양온도 변화를 조사하였다. 또한 지상온도와 토양온도의 상관관계, 강수인자와 토양수분 변화량의 상관관계를 평가하였다. 도출된 연구 결과는 강수가 토양수분 함량에 미치는 영향과 토성에 따른 토양수분 상태를 파악하여 토성별 관개량 설정의 기초자료로 활용될 수 있을 것이다.

Materials and Methods

연구시설 및 시험토양 본 연구는 전라북도 완주군 이서면 국립농업과학원의 중량 라이시미터 (Weighable Lysimeter System, UGT, Germany) 시설에서 수행되었다. 본 연구시설은 해발고도 33 m, 북위 35°49′29″, 동경 127°02′46″에 위치하고 있다. 중량 라이시미터는 표면적 1.0 m2, 깊이 1.5 m의 스테인레스강 원통형에 교란되지 않은 자연상태의 논토양이 충진되어 있다. 시험에 사용된 토양은 식질 계통의 미사질식양토 (fine clayey-silty clay loam, FC-SiCL), 사양질 계통의 양토 (coarse loamy-loam, CL-L), 사양질 계통의 사양토 (coarse loamy-sandy loam, CL-SL)로 총 3종류이고, 각 토양마다 3반복으로 배치하였다. 토양 특성은 Table 1에 나타내었다. 토양 층위 구분은 Soil Survey Staff (1999)에 따라 실시하였으며, 토양 특성은 깊이별로 용적밀도 (bulk density), 토양유기물 (soil organic matter, SOM) 함량, 포장용수량 (field capacity), 토성 (soil texture)을 조사하였다. 용적밀도는 Blake and Hartge (1986)가 제안한 코아법, 토양유기물 함량은 국립농업과학원의 토양화학분석법 (NAAS, 2010)에 제시된 Tyurin법을 이용하였다. 포장용수량은 토양물리성 조사방법 (NIAS, 2017)에 따라 교란시료를 이용하여 0.3 bar 조건에서 토양수분함량을 측정하였다. 토성은 비중계법 (Gee and Bauder, 1986)에 따라 토양입자분포 (soil particle distribution) 산정 후 미국 농무부 (United States Department of Agriculture, USDA)의 토성 삼각표 (soil texture triangle)에 따라 결정하였다. 본 라이시미터 연구 시설과 토양은 Seo et al. (2017), Kim et al. (2018a), Han and Seo (2019)의 연구에 사용된 바 있다.

Table 1.

Characteristics of soils by depth used in this study.

Soil Soil depth BD SOM FC Particle size distribution Soil texture
Sand Silt Clay
cm Mg m-3 g kg-1 % ------------ % ------------
FC-SiCL 0-19 1.11 23 39.7 5.9 64.1 30.0 Silty clay loam
20-48 1.38 17 37.4 5.3 54.5 40.2 Silty clay
49-71 1.37 7 32.9 2.7 55.1 42.2 Silty clay
72-114 1.40 7 31.8 3.9 58.7 37.4 Silty clay loam
115-150 1.40 3 36.8 4.6 59.1 36.3 Silty clay loam
CL-L 0-20 1.20 19 38.9 42.3 47.7 10.0 Loam
21-40 1.47 10 33.7 44.7 45.3 10.0 Loam
41-67 1.41 4 28.9 43.8 47.2 9.0 Loam
68-89 1.41 4 26.8 51.8 40.2 8.0 Loam
90-114 1.28 3 16.1 75.3 22.7 2.0 Loamy sand
115-150 1.25 ND 12.3 83.9 14.1 2.0 Sand
CL-SL 0-13 1.20 14 32.8 52.6 37.4 10.0 Sandy loam
14-28 1.33 11 35.4 52.8 39.2 8.0 Sandy loam
29-69 1.41 5 24.8 50.1 40.9 9.0 Loam
70-95 1.36 5 22.0 61.4 32.6 6.0 Sandy loam
96-130 1.40 6 24.4 59.8 34.2 6.0 Sandy loam
131-150 1.42 7 21.9 57.4 34.6 8.0 Sandy loam

FC-SiCL, fine clayey and silty clay loam; CL-L, coarse loamy and loam; CL-SL, coarse loamy and sandy loam.

BD, bulk density; SOM, soil organic matter; FC, field capacity.

라이시미터 및 기상 데이터 측정 본 연구는 인위적 영향을 배제하고 자연상태조건에서 기상, 토양수분, 증발산의 관계를 파악하고자 하였으며, 연구기간은 벼 수확 후와 영농활동 전 토양의 자연상태 유지를 고려하여 2017년 1월 1일부터 4월 12일까지 진행되었다. 증발산은 중량 라이시미터의 질량 값으로 계산되며, 토양질량 측정은 weighing system (Load Cell, UGT, Germany)이 이용되었다. Weighing system은 최대 3,600 kg까지 측정 가능하며 감도는 10 g이다. 토양수분 함량과 토양온도는 라이시미터에 깊이별 (0.1 m, 0.3 m, 0.55 m, 0.85 m, 1.25 m)로 매설된 soil water and temperature sensor (UMP-1, UGT, Germany)로 측정되었다. 측정된 토양질량, 토양수분, 토양온도 데이터는 1시간 평균값으로 data logger (UGTLog, UGT, Germany)에 저장된다. 기상 데이터는 라이시미터 시설에 설치된 기상관측장비 (Weather Information System, WIS, STA Co., Korea)로 측정하였으며, 강수와 지상온도 자료를 수집하였다.

증발산량, 토양수분 변화량, 강우인자 산정 증발산량 (evapotranspiration, ET)은 2017년 1월 1일부터 4월 12일까지의 라이시미터 질량 데이터로 계산되었다. 그 계산 공식은 Klammler and Fank (2014)가 제안한 방법이고 Eq. 1과 같다.

$$ET=P+I-D-R$$ (Eq. 1)

ET는 증발산량 (mm day-1), P (precipitation)는 강수량 (mm day-1), I (irrigation)는 관개량 (mm day-1), D (drainage)는 지하유출량 (mm day-1), R (run-off water)은 지표유거량 (mm day-1)을 나타낸다.

또한 순별 (상순, 중순, 하순)과 월별 증발산 변화를 파악하고자 일 증발산을 순별과 월별 합으로 구분하였다.

토양수분 변화량과 강수인자의 상관관계 분석을 위하여 강수발생에 의한 토양수분 변화량은 강수발생 종료일 (연속강우일 경우 연속강우 종료일)의 토양수분함량에서 강수발생 전날의 토양수분함량을 감하여 계산하였다. 강수인자는 강수량, 강수강도, 강수운동에너지를 고려하였다. 강수량 (amount of precipitation, PR)은 강수발생일 동안의 합산량, 강수강도는 강수시간에 대한 강수량의 비, 강수운동에너지는 강수시 발생하는 에너지 값을 나타낸 것이다.

강수강도 (precipitation intensity, PI)는 Renard et al. (1997)이 제안한 단순 산출식으로부터 계산하였다. 그 공식은 Eq. 2와 같다.

$$\Pi=\frac{amount\;of\;<\;ipitation}{<\;ipitaion\;time}$$ (Eq.2)

PI는 강수강도 (mm h-1), amount of precipitation은 강수량 (mm), precipitation time은 강수발생시간 (h)을 나타낸다.

강수운동에너지는 (precipitation kinetic energy, PKE)는 Eq. 3의 공식과 같고, Brown and Foster (1987)가 제안한 공식이다.

$$PKE=29(1-0.72e^{-0.05p})$$ (Eq.3)

PKE는 강수운동에너지 (J m-2 mm-1), p는 강수강도 (mm h-1)로서 Eq. 2 공식으로 계산된다.

통계분석 시험에 사용된 3종류 토양의 증발산량에 대한 유의성 검증은 Duncan’s multiple range test를 실시하였다. 지상온도와 토양온도의 상관관계, 토양수분 변화량과 강수인자의 상관관계는 Pearson’s correlation analysis를 실시하였다. 통계분석 프로그램은 SPSS (statistical package for the social sciences, ver. 18.0, SPSS, Inc., Chicago, IL, USA)를 이용하였다.

Results and Discussion

증발산량 변화 식질-미사질식양토 (FC-SiCL), 사양질-양토 (CL-L), 사양토-사양토 (CL-SL)의 증발산량은 상순 (the first part of a month, FPM), 중순 (the middle part of a month, MPM), 하순 (the last part of a month, LPM)으로 구분하여 비교하였으며, 그 결과는 Table 2와 같다. 기온 상승에 따라 증발산은 1월에서 4월로 갈수록 증가하는 것으로 나타났다. 1월은 MPM에 FC-SiCL의 증발산량이 낮게 나타났으나 토양간 증발산량 차이는 나타나지 않았다. 2월은 LPM을 제외하고 FC-SiCL의 증발산량이 낮게 나타났다. 3월은 FPM에 토양간 증발산량 차이가 없었으나 MPM, LPM, 3월 합산은 CL-L의 증발산이 높게 나타났다. 4월은 1일부터 12일까지의 증발산량이며 CL-L의 증발산량이 높게 나타났다. 연구기간 동안 증발산 총량은 CL-L > CL-SL > FC-SiCL 순서로 나타났다. CL-L은 0.1 m 깊이의 최대수분함량이 낮아 증발산이 높고, FC-SiCL은 0.1 m와 0.3 m 깊이에서 최대수분함량이 높아 증발산이 낮은 것으로 보인다. 0.1 m와 0.3 m 깊이 토양의 최대수분함량은 Table 4와 5에서 확인할 수 있다. Agassi et al. (1994)은 점토와 미사 비율이 높을수록 토양수분함량이 높다고 보고하였고, FC-SiCL 역시 미사와 점토 함량이 높은 토양이다 (Table 1).

Table 2.

Comparison of evaporation in different paddy soils by the part of a month during non-cultivated period.

Month Part of a month FC-SiCL CL-L CL-SL
Jan. FPM (1-10) 7.46 ± 0.42 a 7.76 ± 0.35 a 7.18 ± 0.05 a
MPM (11-20) 6.80 ± 0.24 b 7.16 ± 0.10 ab 7.27 ± 0.30 a
LPM (21-31) 8.83 ± 0.41 a 9.52 ± 0.48 a 9.06 ± 0.42 a
Subtotal in Jan. 23.09 ± 0.63 a 24.44 ± 0.89 a 23.51 ± 0.75 a
Feb. FPM (1-10) 9.21 ± 0.41 b 10.55 ± 0.40 a 10.08 ± 0.41 a
MPM (11-20) 11.21 ± 0.21 b 13.89 ± 0.47 a 13.37 ± 0.53 a
LPM (21-28) 12.04 ± 1.10 a 12.35 ± 0.76 a 12.21 ± 0.23 a
Subtotal in Feb. 32.46 ± 1.60 b 36.79 ± 1.43 a 35.66 ± 0.92 a
Mar. FPM (1-10) 17.98 ± 1.50 a 19.15 ± 0.65 a 17.76 ± 0.56 a
MPM (11-20) 17.06 ± 0.44 b 18.39 ± 0.61 a 17.05 ± 0.67 b
LPM (21-31) 18.38 ± 0.33 c 21.29 ± 0.62 a 19.51 ± 0.44 b
Subtotal in Mar. 53.42 ± 1.84 b 58.83 ± 1.31 a 54.32 ± 1.38 b
Apr. FPM (1-12) 27.09 ± 0.35 c 32.46 ± 0.52 a 30.05 ± 0.39 b
Total Jan. 1 - Apr. 12 136.06 ± 4.03 c 152.52 ± 3.61 a 143.54 ± 2.46 b

FPM, first part of a month; MPM, middle part of a month; LPM, last part of a month.

Numbers followed by different letters within a row are significant at p < 0.05 using Duncan's multiple range test.

토양온도 변화, 지상온도와 토양온도의 상관관계 2017년 1월 1일부터 4월 12일까지 지상온도, 깊이별 토양온도, 일증발산량 변화를 Fig. 1에 나타내었다. FC-SiCL, CL-L, CL-SL 3 종류 토양 모두 토양온도 변화 경향은 비슷하였다. 지상온도 변화에 따라 FC-SiCL, CL-L, CL-SL 토양 모두 0.1 m 깊이의 토양온도가 가장 민감하게 반응하였다. 하지만 지상온도가 영하권으로 내려가더라도 토양온도는 영하권으로 쉽게 내려가지 않았다. 연구기간 동안 0.1 m 깊이의 최저 토양온도는 FC-SiCL 영하 0.5°C, CL-L 영하 0.3°C, CL-SL 0.5°C였다. 0.3 m 깊이 이상은 영상권을 유지하였다. 그리고 3월 28일까지는 대체적으로 토양 깊이가 깊을수록 토양온도가 높게 나타났으나 3월 29일부터 0.1 m 깊이의 토양온도가 높아지기 시작하였다. 지상온도가 증가함에 따라 온도 반응이 민감한 0.1 m 깊이가 토양온도 변화에 큰 영향을 받은 것으로 보인다. 지상온도와 토양온도 증가에 따라 증발산도 증가하는 경향이었으며 강수발생 일자에는 증발산이 낮게 나타났다. Kim et al. (2019)의 연구에서 기준증발산량은 지상온도와 정의 상관관계이고 강수와 부의 상관관계임을 보고하였다. 2월 초부터 CL-L과 CL-SL의 증발산이 FC-SiCL보다 높아지기 시작하였으며, 3월 초부터는 CL-L의 증발산이 CL-SL과 FC-SiCL보다 높아지기 시작하였다. 이러한 경향으로 연구기간 동안 총 증발산 순위가 CL-L > CL-SL > FC-SiCL로 나타났다 (Table 2). Kim et al. (2018a) 역시 겨울에서 봄이되면 영상기온으로 회복되어 증발산이 증가한다고 보고하였다. 지상온도 변화에 따라 깊이별 토양온도 역시 변화하였으며, 특히 0.1 m 깊이의 토양온도가 민감하게 반응하여 지상온도와 깊이별 토양온도의 상관관계를 조사하였다. 그 결과 (Table 3), FC-SiCL, CL-L, CL-SL 토양의 조사한 모든 깊이에서 토양온도와 지상온도가 고도로 유의한 정의 상관 (p < 0.01)이 있는 것으로 나타났다. 특히 0.1 m 깊이의 토양온도와 지상온도가 0.9 이상의 상관계수를 보임에 따라 토양표면이 지상온도에 가장 민감하게 반응함을 확인할 수 있었다. Zheng et al. (1993)의 연구에 따르면 토양표면은 지상온도의 직접 영향을 받으므로 지상온도와 강수량을 이용하여 토양 10 cm 깊이의 온도를 예측할 수 있고, 그 예측 결과 0.85 이상의 높은 적합도가 나타났다.
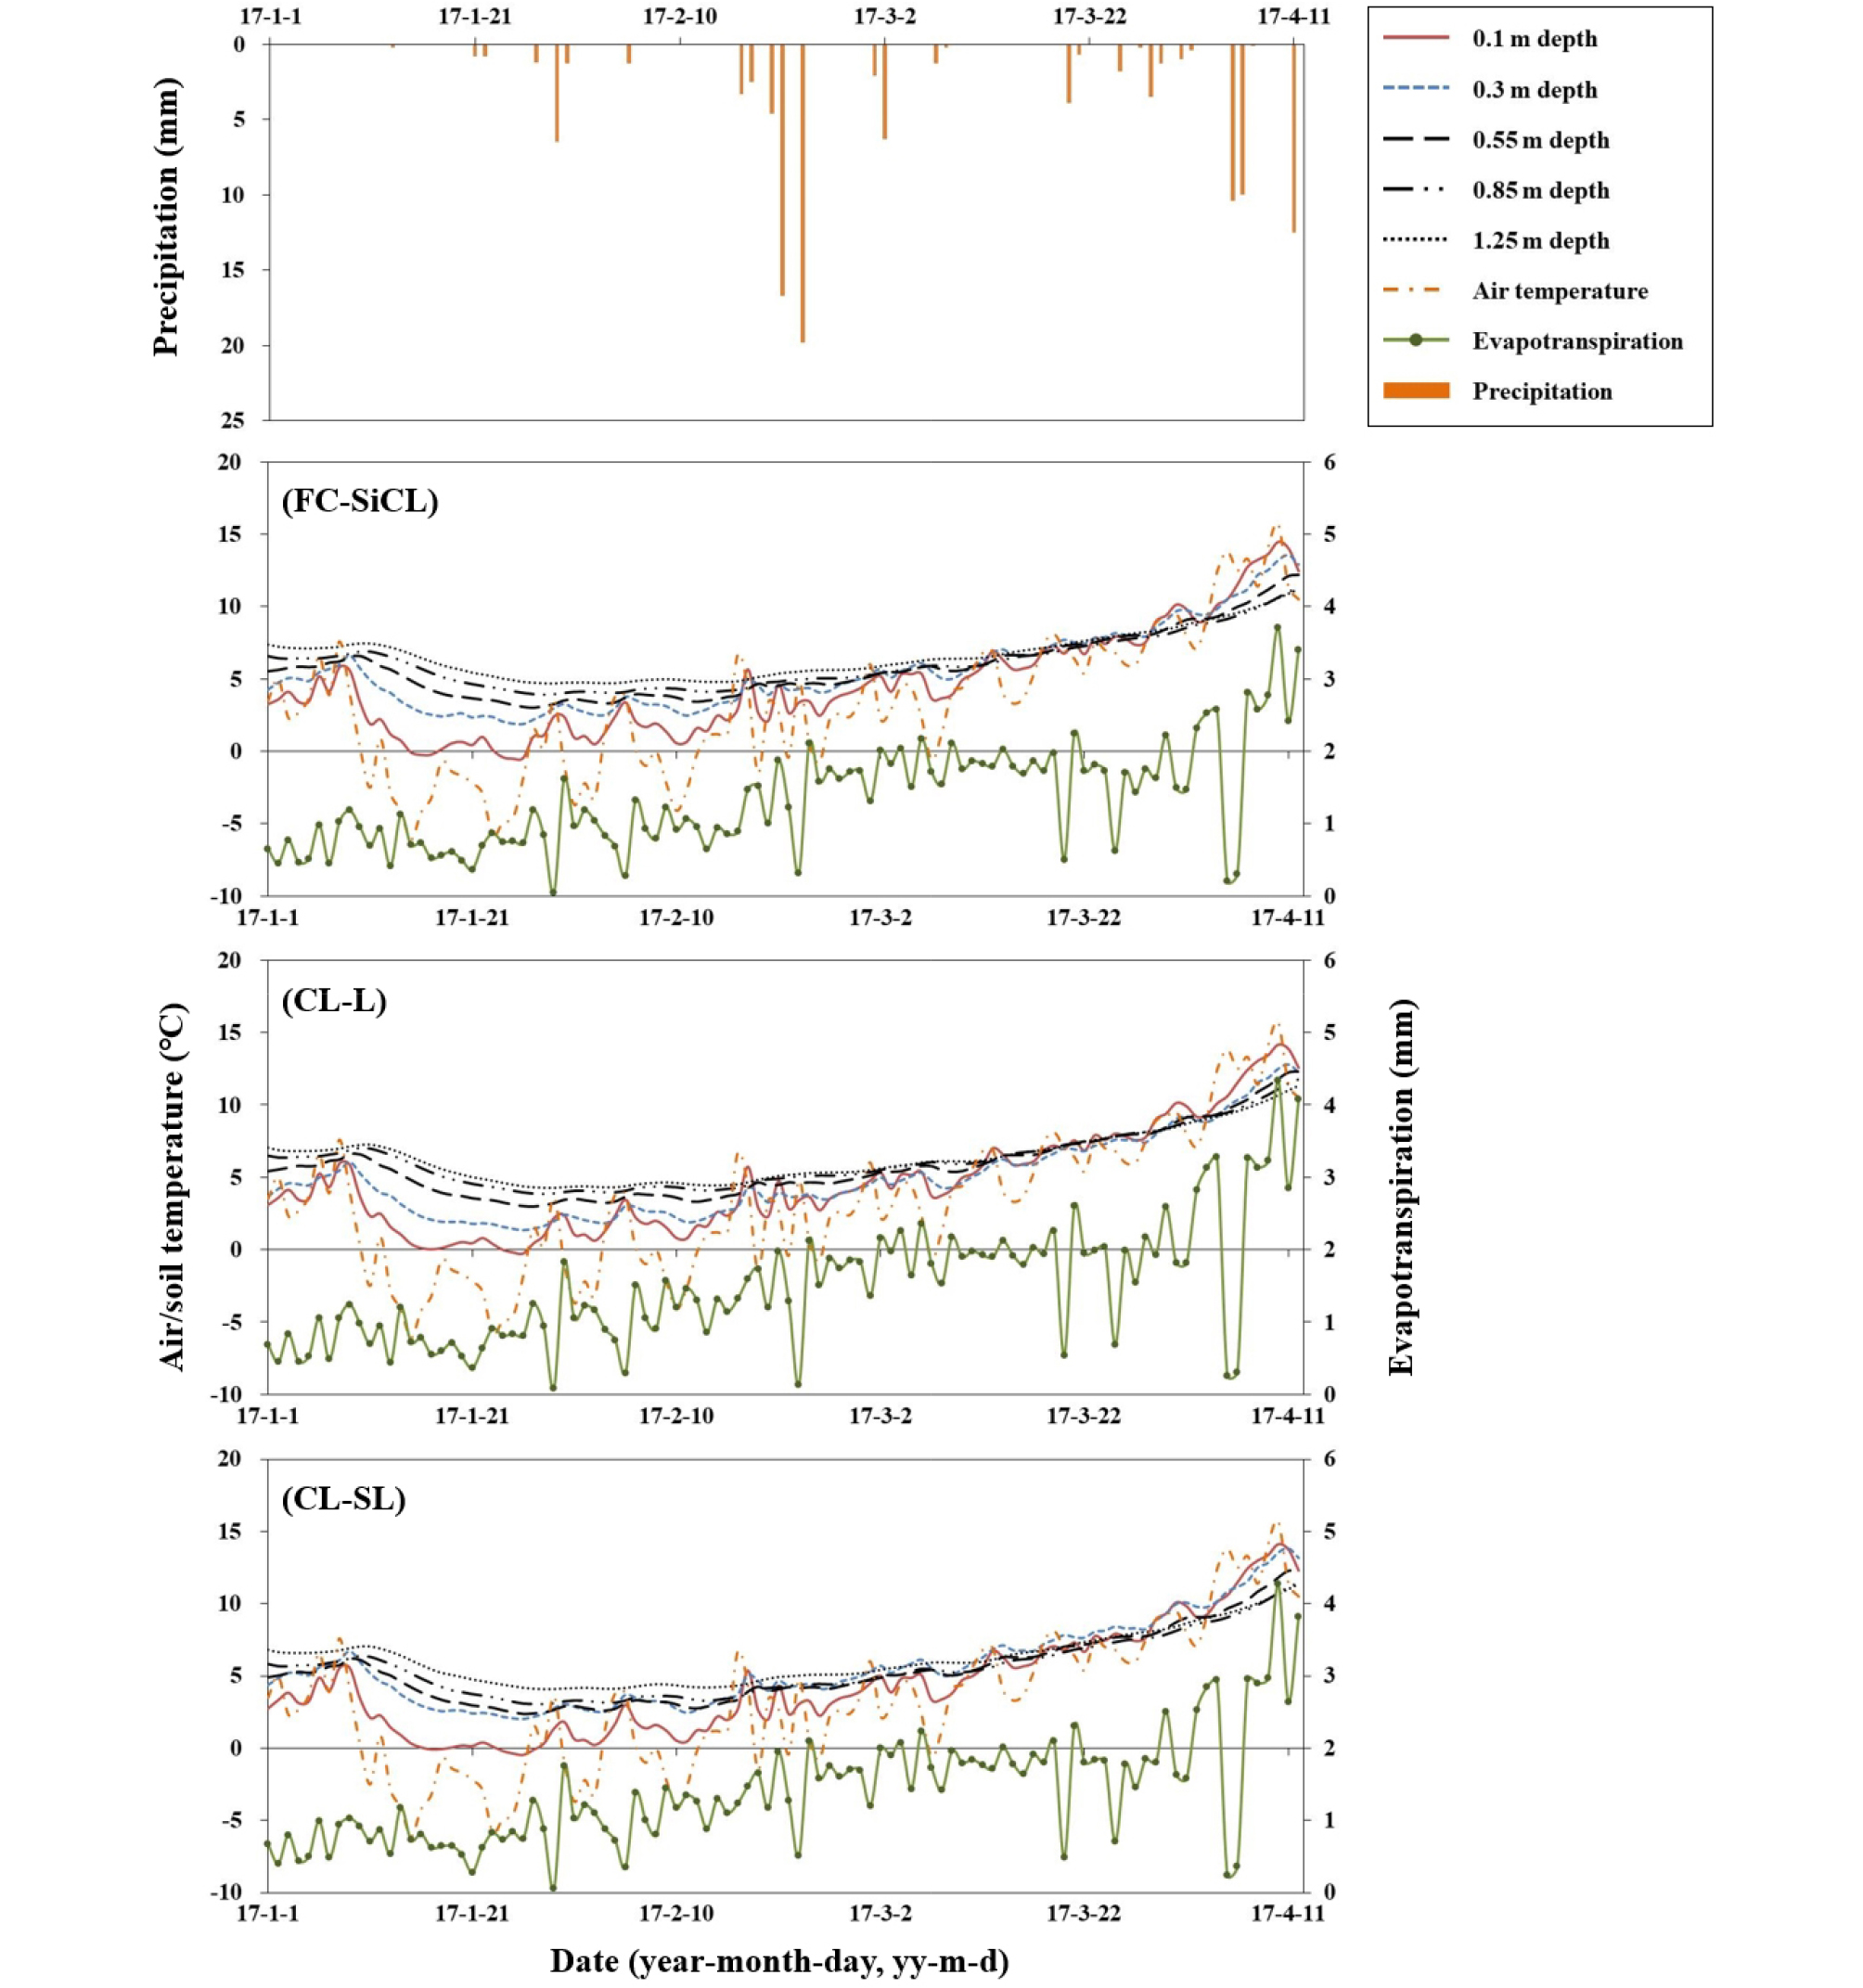
http://static.apub.kr/journalsite/sites/ksssf/2020-053-03/N0230530308/images/ksssf_53_03_08_F1.jpg
Fig. 1.

Changes in air/soil temperature and evapotranspiration in different paddy soils during non-cultivated period from January 1 to April 12 in 2017.

Table 3.

Relationships between the air temperature and soil temperature in different paddy soils during non-cultivated period.

Soil depth FC-SiCL (n = 102) CL-L (n = 102) CL-SL (n = 102)
m
Air temperature 0.10 0.933** 0.926** 0.922**
0.30 0.887** 0.877** 0.881**
0.55 0.830** 0.832** 0.840**
0.85 0.782** 0.792** 0.800**
1.25 0.763** 0.770** 0.781**

FC-SiCL, fine clayey and silty clay loam; CL-L, coarse loamy and loam; CL-SL, coarse loamy and sandy loam.

Correlation coefficient (r) was determined by Pearson correlation analysis to evaluate the relationship between parameters. Results were evaluated with 95% and 99% confidence intervals; *, significant at p < 0.05, and **, significant at p < 0.01 level.

토양수분 변화, 강수인자와 토양수분 변화량의 상관관계 FC-SiCL, CL-L, CL-SL토양의 깊이별 토양수분함량의 일 변화를 Fig. 2에 나타내었다. FC-SiCL, CL-L, CL-SL 3 종류 토양 모두 0.1 m 깊이에서 토양수분함량이 민감하게 반응하였으며, 강수발생일에 토양수분함량이 증가하고 강수가 종료되면 토양수분함량이 서서히 감소하였다. FC-SiCL은 CL-L과 CL-SL보다 강수 후 수분함량 변화가 크게 나타났다. 점토함량이 높은 FC-SiCL은 갈라짐이 발생하였고 (Fig. 3), 이로 인하여 표토 이하 깊이로 수분침투가 활발해졌기 때문으로 판단된다. FC-SiCL은 토양깊이 0.3 m의 토양수분함량이 높게 나타났다. 점토함량이 높은 토양은 wet-dry 순환이 반복적으로 일어날 경우 갈라짐이 발생하고 갈라진 틈은 수분이동 통로로 이용되어 갈라진 표토층의 수분함량은 감소하게 된다 (Bouma, 1980; Li et al., 2016; Wan et al., 2016, Wan et al., 2018). 토양깊이 0.3 m에서는 강수 영향으로 토양수분함량 변화가 있었으나 0.1 m 깊이 보다는 민감하지 않았고, 0.55 m 깊이부터는 토양수분함량의 일 변화 차이가 나타나지 않았다. 토양별로 구분하면, FC-SiCL은 0.1 m 깊이에서 강수발생에 따라 특정일에 토양수분함량이 높게 나타난 것을 제외하면 0.55 m 깊이 이상에서 토양수분함량이 35% 이상으로 높게 나타났다. 토양깊이 0.55 m, 0.85 m 및 1.25 m에서 토양수분함량 차이는 크지 않았다. CL-L은 1.25 m 깊이에서 토양수분함량이 37% 이상으로 가장 높게 유지되었고, 0.55 m 깊이의 토양수분함량은 0.1 m와 0.3 m 보다 낮게 나타났다. CL-SL은 0.55 m, 0.85 m 및 1.25 m의 토양수분함량이 0.1 m 깊이 보다 낮게 나타났다. 토양깊이 0.1 m에서 토양수분함량의 최대값과 최소값은 각각 FC-SiCL 40.7%, 28.7%, CL-L 37.1%, 32.3%, CL-SL 37.4%, 32.6%이었고, FC-SiCL의 변화 폭이 가장 크게 나타났다 (Table 4). 0.3 m 깊이 토양수분함량의 최대값과 최소값은 각각 FC-SiCL 35.9%, 33.0%, CL-L 34.8%, 31.3%, CL-SL 32.3%, 25.3%로서 CL-SL이 가장 큰 변화를 보였으며 FC-SiCL이 높은 토양수분함량을 유지하였다 (Table 5). 강수발생일에 강수인자로서 강수량 (amount of precipitation, PR), 강수강도 (precipitation intensiy, PI), 강수운동에너지 (precipitation kinetic energy, PKE)을 산출하였고, 강수발생에 따라 토양수분함량 변화가 나타난 0.1 m와 0.3 m 깊이에서 토양수분 변화량을 조사하였다 (Table 4와 Table 5). PR이 높더라도 강수시간이 길어지면 PI와 PKE가 낮아지는 것을 확인하였다. 토양깊이 0.1 m에서 가장 큰 토양수분 변화량은 FC-SiCL +7.8% (PR 21.3 mm, RI 1.64 mm h-1, PKE 9.76 J m-2 mm-1), CL-L +3.7% (PR 20.5 mm, RI 0.89 mm h-1, PKE 9.03 J m-2 mm-1), CL-SL +3.5% (PR 20.5 mm, RI 0.89 mm h-1, PKE 9.03 J m-2 mm-1) 이었다. 연구기간 동안 강수량이 3번째로 많았던 2월 22일 (19.8 mm)은 0.1 m 깊이 토양수분 변화량이 FC-SiCL +0.8%, CL-L +1.3%, CL-SL +1.1%로 변화량이 크지 않았지만, 강수량이 7.8 mm이었던 1월 29일~30일은 0.1 m 깊이 토양수분 변화량이 FC-SiCL +5.5%, CL-L +2.8%, CL-SL +2.7%로서 적은 강수량에 비해 큰 변화량이 나타났다. 토양이 보유할 수 있는 수분의 최대 함량이 있으므로 강수전 토양수분함량에 따라 수분 변화량 차이가 나타났다. 토양깊이 0.3 m에서 토양수분 변화량은 FC-SiCL -0.6~+1.6, CL-L -0.3~+1.2, CL-SL -0.5~+1.7로 나타났고, 0.1 m 깊이 토양수분 변화량보다 낮게 나타났다. 강수발생이 있었음에도 토양수분 변화량이 음수인 경우는 PR, PI, PKE가 낮아 충분한 증발이 일어났기 때문으로 판단된다. Table 4와 Table 5의 결과를 바탕으로, 강수인자와 토양수분 변화량의 상관관계를 조사한 결과는 Table 6과 같다. 강수량과 토양수분 변화량은 0.1 m 깊이와 0.3 m 깊이의 3 종류 토양 모두에서 고도로 유의한 정의 상관 (p < 0.01) 관계가 나타났다. 강수강도 및 강수운동에너지는 0.1 m 깊이 토양수분 변화량과 유의한 정의 상관성 (p < 0.05)을 나타내었고, 0.3 m 깊이 토양수분 변화량과는 유의성이 없는 정의 상관관계를 보였다. 토양수분 변화가 민감한 0.1 m 깊이의 경우 강수량, 강수강도, 강수강도에너지 모두와 상관성이 있음을 확인하였다. Hawke et al. (2006)의 연구에 의하면 토양 깊이가 깊어질수록 토양수분 변화가 작고, 강우강도가 클수록 최대수분함량에 도달하는 시간이 짧아진다고 하였다. 또한 Liu et al. (2011)은 초기 토양수분함량이 높을 경우 공극이 감소하여 토양수분 침투속도가 느리다고 보고하였다. 장기간 데이터를 축적하여 강수발생전 토양수분함량 수준에 따라 그룹화하여 강수인자와 상관성을 분석하는 후속 연구가 필요할 것으로 생각된다.
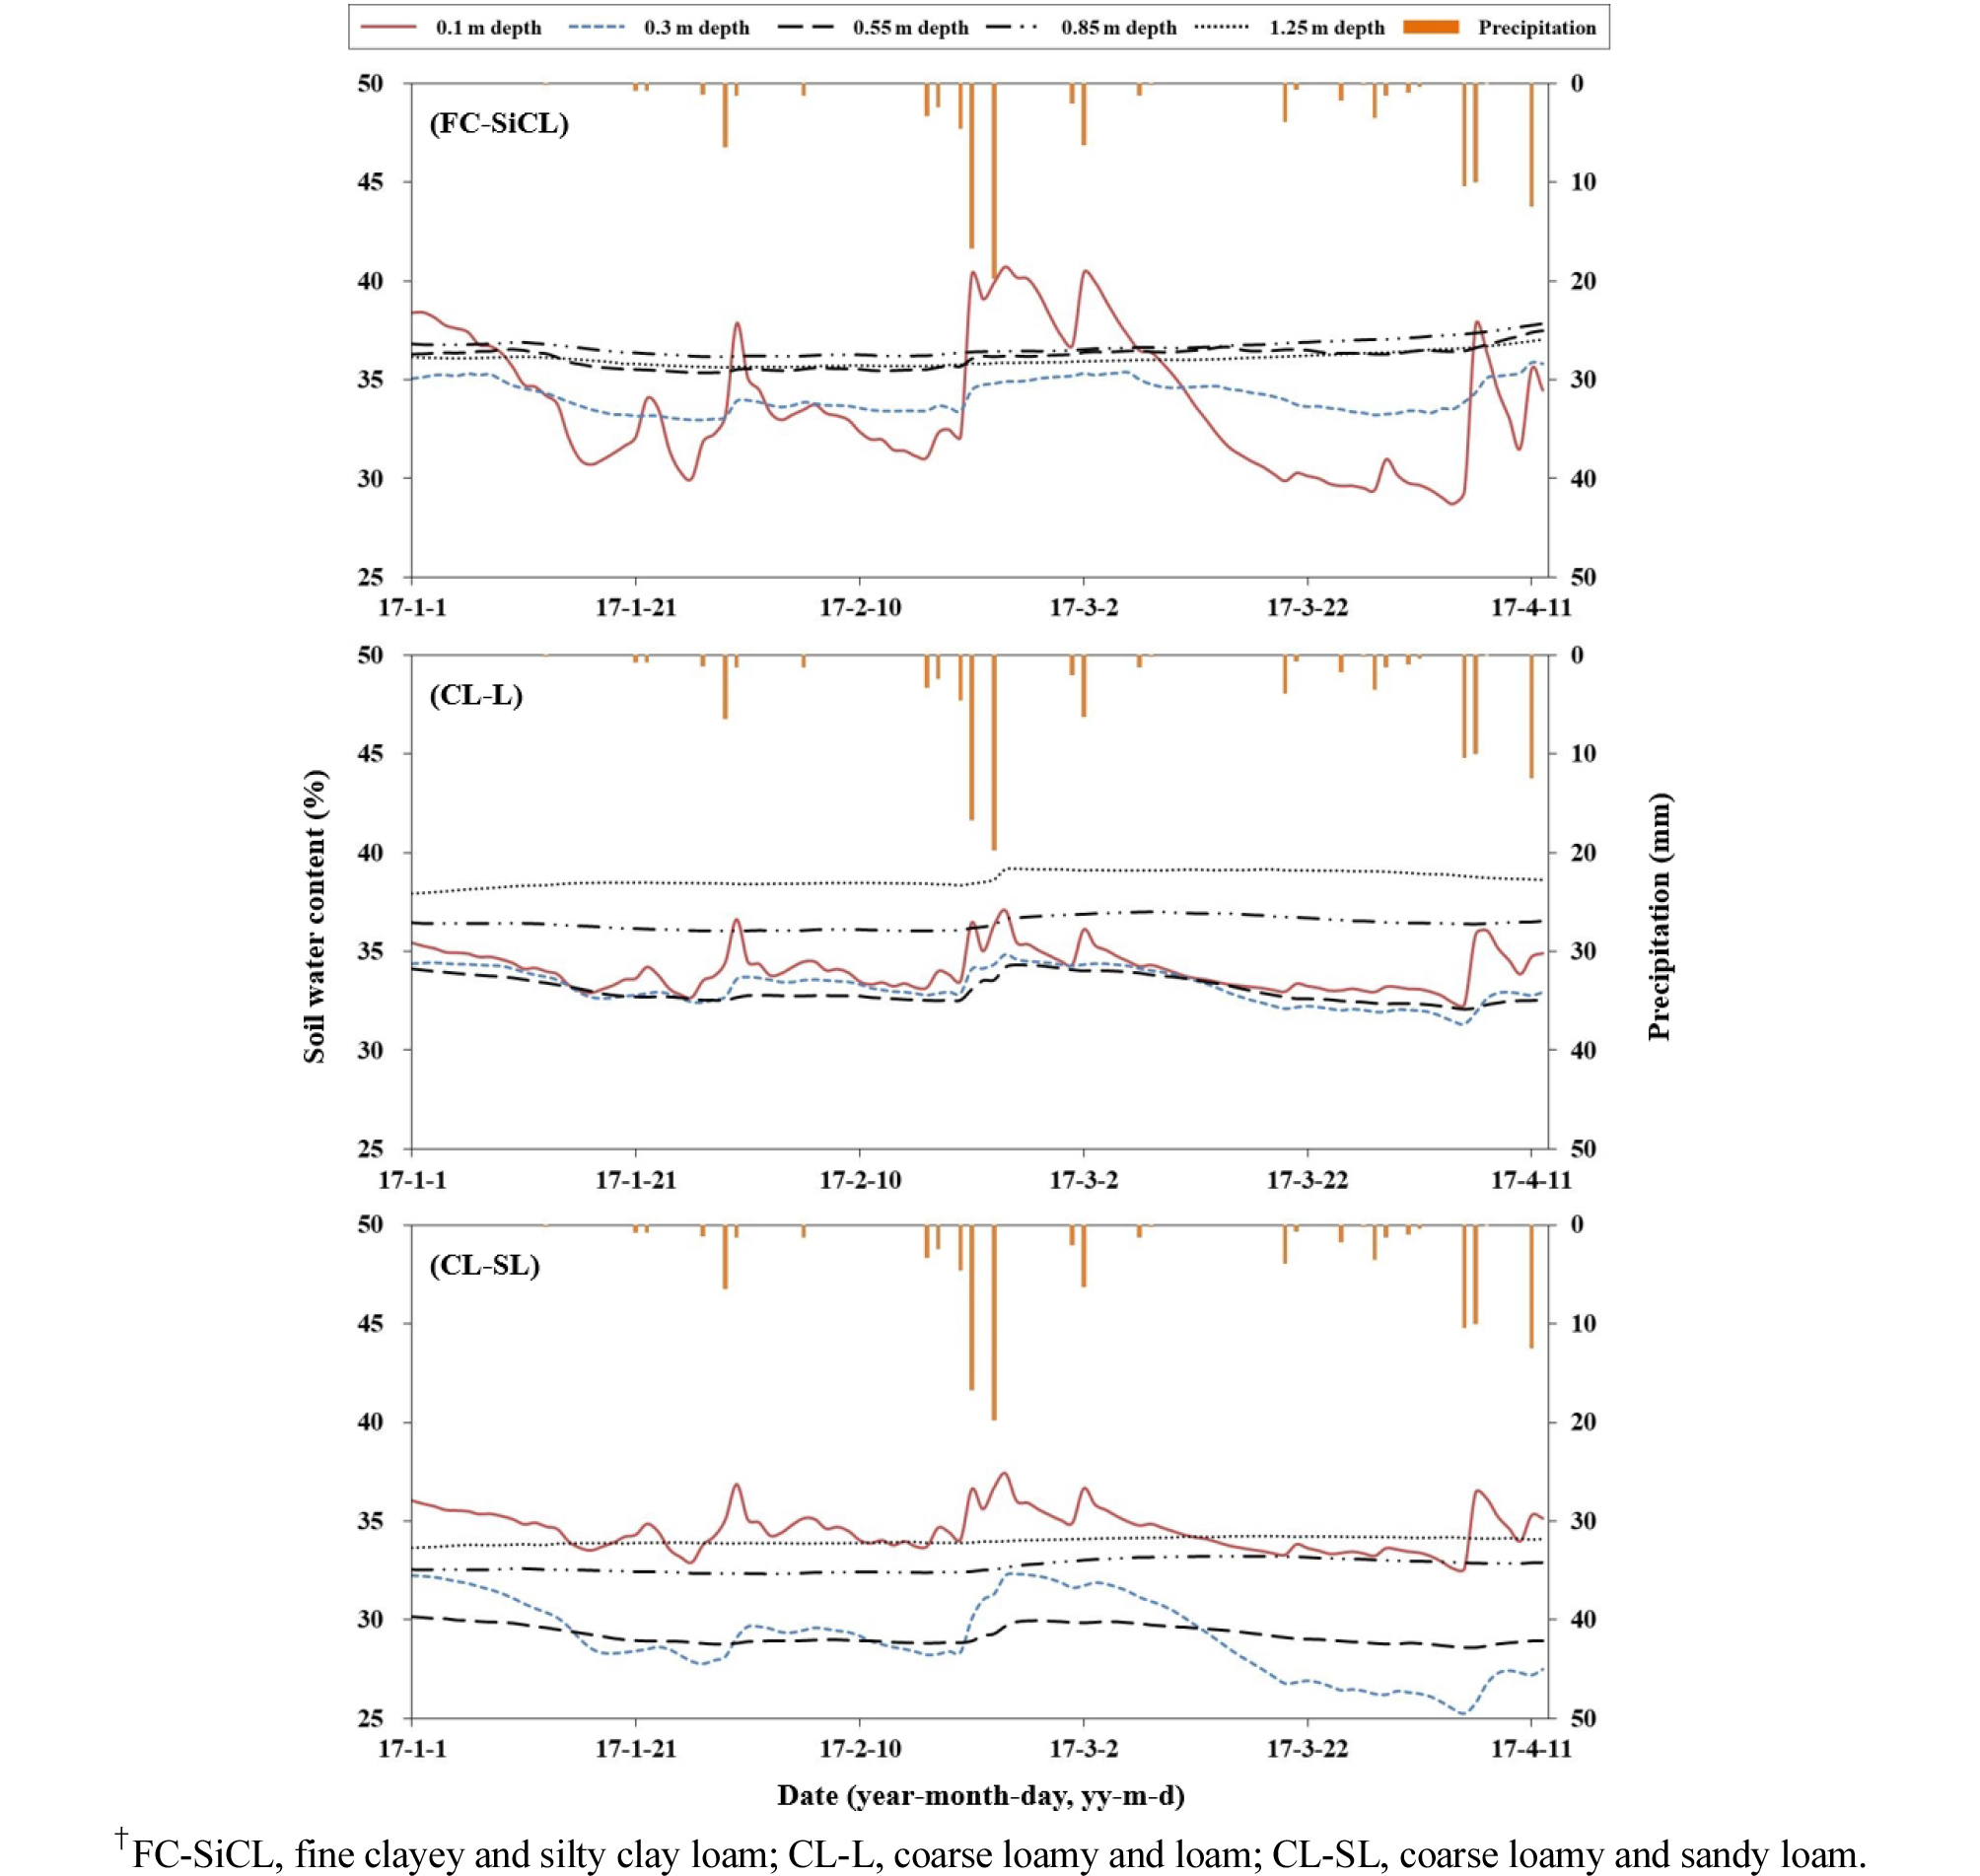
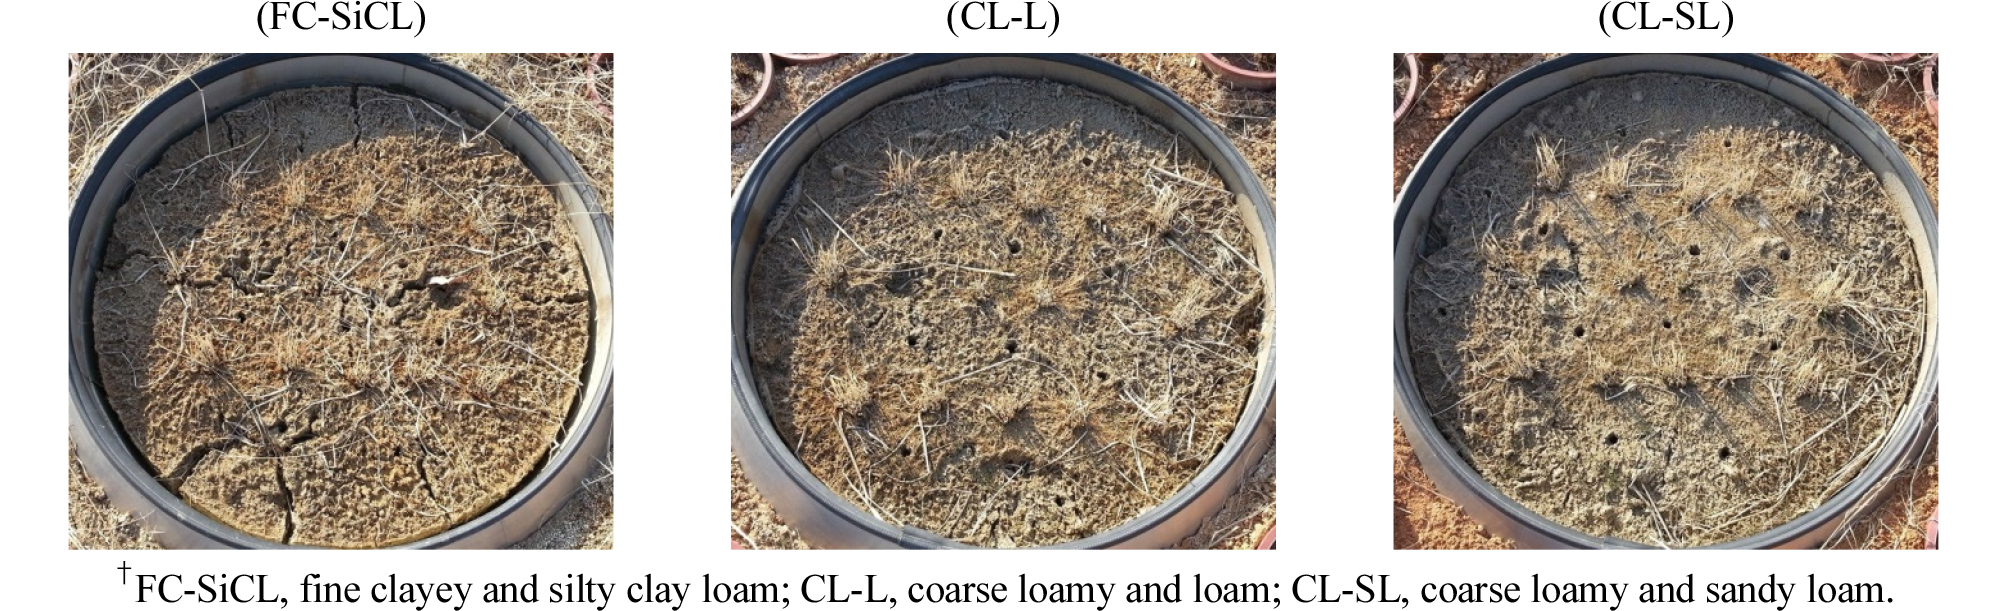
http://static.apub.kr/journalsite/sites/ksssf/2020-053-03/N0230530308/images/ksssf_53_03_08_F2.jpg
Fig. 2.

Changes in soil water content at five depths and precipitation from January 1 to April 12 in 2017.

http://static.apub.kr/journalsite/sites/ksssf/2020-053-03/N0230530308/images/ksssf_53_03_08_F3.jpg
Fig. 3.

The crack phenomenon of silty clay loam and state of loam and sandy loam in non-cultivated season.

Table 4.

Change content of soil water of 0.1 m soil depth as affected by precipitation in different paddy soils during non-cultivated period.

Date of precipitation event Precipitation parameter FC-SiCL CL-L CL-SL
PR PI PKE SWE SWB △SW SWE SWB △SW SWE SWB △SW
mm mm h-1 J m-2 mm-1 -------- % -------- -------- % -------- -------- % --------
Jan. 13 0.2 0.20 8.33 34.2 34.6 -0.4 34.0 34.2 -0.2 34.7 34.9 -0.2
Jan. 21-22 1.6 0.32 8.45 34.1 31.7 +2.4 34.2 33.6 +0.6 34.9 34.2 +0.7
Jan. 27 1.2 0.60 8.74 31.9 30.0 +1.9 33.5 32.7 +0.8 33.8 32.9 +0.9
Jan. 29-30 7.8 0.52 8.66 37.8 32.3 +5.5 36.6 33.8 +2.8 36.9 34.2 +2.7
Feb. 5 1.3 0.43 8.57 33.5 33.2 +0.3 34.5 34.2 +0.3 35.2 34.8 +0.4
Feb. 16-17 5.8 0.53 8.66 32.3 31.1 +1.2 34.0 33.2 +0.8 34.7 33.7 +1.0
Feb. 19-20 21.3 1.64 9.76 40.3 32.5 +7.8 36.5 33.8 +2.7 36.6 34.4 +2.2
Feb. 22 19.8 1.32 9.45 39.9 39.1 +0.8 36.3 35.0 +1.3 36.7 35.6 +1.1
Mar. 1-2 8.4 0.93 9.07 40.4 37.2 +3.2 36.1 34.5 +1.6 36.7 35.0 +1.7
Mar. 7-8 1.5 0.38 8.51 36.4 37.2 -0.8 34.3 34.5 -0.2 34.9 35.0 -0.1
Mar. 20-21 4.6 0.51 8.65 30.3 30.2 +0.1 33.4 33.0 +0.4 33.8 33.4 +0.4
Mar. 25 1.8 0.23 8.35 29.6 29.7 -0.1 33.0 33.0 +0.0 33.4 33.3 +0.1
Mar. 27-29 5.0 0.56 8.69 31.0 29.6 +1.4 33.2 33.1 +0.1 33.6 33.5 +0.1
Mar. 31-Apr. 1 1.4 0.23 8.36 29.7 30.2 -0.5 33.1 33.2 -0.1 33.4 33.6 -0.2
Apr. 5-7 20.5 0.89 9.03 36.4 28.7 +7.7 36.1 32.4 +3.7 36.1 32.6 +3.5
Apr. 11 12.5 1.79 9.90 35.5 31.5 +4.0 34.7 33.9 +0.8 35.3 34.0 +1.3
Max. Max. Max. Max. Mean Min. Max. Mean Min. Max. Mean Min.
During period 21.3 1.79 9.90 40.7 33.8 28.7 37.1 34.0 32.3 37.4 34.5 32.6

PR, amount of precipitation; PI, precipitation intensity; PKE, precipitation kinetic energy.

FC-SiCL, fine clayey and silty clay loam; CL-L, coarse loamy and loam; CL-SL, coarse loamy and sandy loam.

SWE, soil water content at the end of precipitation; SWB, soil water content before precipitation; △SW, change content of soil water = SWE - SWB.

Table 5.

Change content of soil water of 0.3 m soil depth as affected by precipitation in different paddy soils during non-cultivated period.

Date of precipitation event Precipitation parameter FC-SiCL CL-L CL-SL
PR PI PKE SWE SWB △SW SWE SWB △SW SWE SWB △SW
mm mm h-1 J m-2 mm-1 -------- % -------- -------- % -------- -------- % --------
Jan. 13 0.2 0.20 8.33 34.3 34.4 -0.1 33.7 33.8 -0.1 30.4 30.6 -0.2
Jan. 21-22 1.6 0.32 8.45 33.2 33.2 +0.0 32.9 32.7 +0.2 28.5 28.4 +0.1
Jan. 27 1.2 0.60 8.74 33.0 33.0 +0.0 32.4 32.4 +0.0 27.8 27.9 -0.1
Jan. 29-30 7.8 0.52 8.66 33.9 33.0 +0.9 33.6 32.6 +1.0 29.1 28.0 +1.1
Feb. 5 1.3 0.43 8.57 33.9 33.7 +0.2 33.5 33.4 +0.1 29.5 29.4 +0.1
Feb. 16-17 5.8 0.53 8.66 33.7 33.4 +0.3 32.9 32.9 +0.0 28.3 28.4 -0.1
Feb. 19-20 21.3 1.64 9.76 34.5 33.6 +0.9 34.1 32.9 +1.2 30.1 28.4 +1.7
Feb. 22 19.8 1.32 9.45 34.8 34.7 +0.1 34.3 34.1 +0.2 31.3 31.0 +0.3
Mar. 1-2 8.4 0.93 9.07 35.3 35.2 +0.1 34.3 34.3 +0.0 31.7 31.9 -0.2
Mar. 7-8 1.5 0.38 8.51 34.8 35.4 -0.6 34.0 34.3 -0.3 30.9 31.4 -0.5
Mar. 20-21 4.6 0.51 8.65 33.7 34.1 -0.4 32.2 32.2 +0.0 26.8 27.1 -0.3
Mar. 25 1.8 0.23 8.35 33.5 33.6 -0.1 32.0 32.1 -0.1 26.4 26.6 -0.2
Mar. 27-29 5.0 0.56 8.69 33.3 33.4 -0.1 31.9 32.1 -0.2 26.2 26.5 -0.3
Mar. 31-Apr. 1 1.4 0.23 8.36 33.4 33.3 +0.1 32.0 32.1 -0.1 26.3 26.4 -0.1
Apr. 5-7 20.5 0.89 9.03 35.1 33.5 +1.6 32.6 31.5 +1.1 26.8 25.5 +1.3
Apr. 11 12.5 1.79 9.90 35.9 35.4 +0.5 32.8 32.9 -0.1 27.2 27.3 -0.1
Max. Max. Max. Max. Mean Min. Max. Mean Min. Max. Mean Min.
During period 21.3 1.79 9.90 35.9 34.2 33.0 34.8 33.2 31.3 32.3 29.1 25.3

PR, amount of precipitation; PI, precipitation intensity; PKE, precipitation kinetic energy.

FC-SiCL, fine clayey and silty clay loam; CL-L, coarse loamy and loam; CL-SL, coarse loamy and sandy loam.

SWE, soil water content at the end of precipitation; SWB, soil water content before precipitation; △SW, change content of soil water = SWE - SWB.

Table 6.

The values of correlation coefficient (r) between the precipitation parameters and change content of soil water (SW).

Parameter Change content of soil water (△SW)
0.1 m depth 0.3 m depth
FC-SiCL (n = 16) CL-L (n = 16) CL-SL (n = 16) FC-SiCL (n = 16) CL-L (n = 16) CL-SL (n = 16)
PR 0.745** 0.784** 0.751** 0.702** 0.691** 0.733**
PI 0.617* 0.513* 0.534* 0.464 0.385 0.455
PKE 0.621* 0.521* 0.542* 0.468 0.391 0.460

PR, amount of precipitation; PI, precipitation intensity; PKE, precipitation kinetic energy.

△SW, change content of soil water = soil water content at the end of precipitation (SWE) - soil water content before precipitation (SWB).

FC-SiCL, fine clayey and silty clay loam; CL-L, coarse loamy and loam; CL-SL, coarse loamy and sandy loam.

Correlation coefficient (r) was determined by Pearson correlation analysis to evaluate the relationship between parameters. Results were evaluated with 95% and 99% confidence intervals; *, significant at p < 0.05, and **, significant at p < 0.01 level.

Conclusion

본 연구에서는 논토양의 비경작 기간 동안 중량 라이시미터를 이용하여 증발산, 토양수분, 토양온도 변화를 조사하였고, 지상온도와 토양온도의 상관관계, 강수인자와 토양수분 변화량의 상관관계를 평가하였다. 연구기간은 2017년 1월 1일부터 4월 12일까지 였으며, 기온 증가와 함께 증발산도 증가하였다. 연구기간 동안 증발산 총량은 CL-L (사양질-양토) > CL-SL (사양질-사양토) > FC-SiCL (식질-미사질식양토) 순서였다. FC-SiCL, CL-L, CL-SL 3 종류 토양 모두 토양온도 변화 경향은 비슷하였고, 0.1 m 깊이의 토양온도가 지상온도 변화에 따라 가장 민감하게 반응하였다. 지상온도와 깊이별 토양온도의 상관관계 조사에서 FC-SiCL, CL-L, CL-SL 토양의 0.1 m, 0.3 m, 0.55 m, 0.85 m, 1.25 m 깊이 모두 토양온도와 지상온도가 고도로 유의한 정의 상관관계 (p < 0.01)였으며, 특히 0.1 m 깊이의 토양온도와 지상온도는 0.9 이상의 높은 상관계수를 나타내었다. 토양수분함량 역시 3 종류 토양 모두 0.1 m 깊이에서 강수발생에 따라 가장 민감하게 반응하였다. 토양깊이 0.3 m에서 강수의 영향으로 토양수분함량 변화가 나타났다. 토양이 보유할 수 있는 최대 수분 함량이 있으므로 강수량이 높더라도 강수발생전 토양수분함량에 따라 토양수분 변화량에 차이가 나타났다. 강수량과 토양수분 변화량은 0.1 m 깊이와 0.3 m 깊이의 3 종류 토양 모두에서 고도로 유의한 정의 상관관계 (p < 0.01)였고, 강수강도 및 강수운동에너지는 0.1 m 깊이 토양수분 변화량과 유의한 정의 상관성 (p < 0.05)이 나타났다. 강수는 토양에 수분 공급을 하는 중요한 인자이며, 비경작 기간 동안 발생한 강우는 토양수분을 회복시키는 역할을 하였다. 기온 상승과 함께 증발산이 증가하는 3월과 4월은 가뭄이 발생할 경우 물관리 대비가 필요할 것이다. 토성, 강수발생 시기 및 강수량 등 강수인자에 따라 토양수분함량 차이가 나타나므로 영농 시작전에 관수관리 계획 수립을 위하여 토성, 토양수분함량 및 강수 상황을 고려할 필요가 있다.

Acknowledgements

This study was financially supported by a grant from the research project (No. PJ01426201) of National Institute of Agricultural Sciences, Rural Development Administration, Republic of Korea.

References

1
Agassi, M., D. Bloem, and M. Ben-Hur. 1994. Effect of drop energy and soil and water chemistry on infiltration and erosion. Water Resour. Res. 30(4):1187-1193.
10.1029/93WR02880
2
Al-Kayssi, A.W., A.A. Al-Karaghouli, A.M. Hasson, and S.A. Beker. 1990. Influence of soil moisture content on soil temperature and heat storage under greenhouse conditions. J. Agric. Eng. Res. 45:241-252.
10.1016/S0021-8634(05)80152-0
3
Allen, R.G., L.S. Pereira, D. Raes, and M. Smith. 1998. FAO irrigation and drainage paper, No. 56, Crop evapotranspiration: guidelines for computing crop water requirements. Food and Agriculture Organization of the United Nations, Rome, Italy.
4
Allen, R.G., L.S. Pereira, T.A. Howell, and M.E. Jensen. 2011a. Evapotranspiration information reporting: Ⅰ. Factors governing measurement accuracy. Agric. Water Manag. 98:899-920.
10.1016/j.agwat.2010.12.015
5
Allen, R.G., L.S. Pereira, T.A. Howell, and M.E. Jensen. 2011b. Evapotranspiration information reporting: Ⅱ. Recommended documentation. Agric. Water Manag. 98:921-929.
10.1016/j.agwat.2010.12.016
6
Anapalli, S.S., L.R. Ahuja, P.H. Gowda, L. Ma, G. Marek, S.R. Evett, and T.A. Howell. 2016. Simulation of crop evapotranspiration and crop coefficients with data in weighing lysimeters. Agric. Water Manag. 177:274-283.
10.1016/j.agwat.2016.08.009
7
Blake, G.R. and K.H. Hartge. 1986. Bulk density in methods of soil analysis. In: A. Klute (ed.). Method of soil analysis. Part 1. (2nd edition). American Society of Agronomy, Madison, Wisconsin, USA.
8
Bouma, J. 1980. Field measurement of soil hydraulic properties characterizing water movement through swelling clay soils. J. Hydrol. 45:149-158.
10.1016/0022-1694(80)90011-6
9
Brown, L.C. and G.R. Foster. 1987. Storm erosivity using idealized intensity distributions. Trans. Am. Soc. Agric. Eng. 30:386-397.
10.13031/2013.31957
10
Choi, Y.H., Y.J. Kim, Y.W. Kim, M.Y. Kim, and J.G. Jeon. 2019. Irrigation water requirements for upland crops using rainfall data and water management guidelines. J. Korean Soc. Agric. Eng. 61(1):121-130.
11
Fredlund, D.G. and A. Xing. 1994. Equations for the soil-water characteristic curve. Can. Geotech. J. 31(4):521-532.
10.1139/t94-061
12
Gee, G.W. and J.W. Bauder. 1986. Particle size analysis. In: A. Klute (ed.). Method of soil analysis. Part 1. (2nd edition). American Society of Agronomy, Madison, Wisconsin, USA.
13
Han, K.W. and M.J. Seo. 2019. Tillage effects on evapotranspiration of three different paddy soils in spring season as tested by monolithic weighable lysimeters. Korean J. Soil Sci. Fert. 52(2):160-171.
14
Hanjra, M.A. and M.E. Qureshi. 2010. Global water crisis and future food security in an era of climate change. Food Policy. 35:365-377.
10.1016/j.foodpol.2010.05.006
15
Hawke, R.M., A.G. Price, and R.B. Bryan. 2006. The effect of initial soil water content and rainfall intensity on near-surface soil hydrologic conductivity: A laboratory investigation. Catena. 65:237-246.
10.1016/j.catena.2005.11.013
16
He, Z.B., W.Z. Zhao, H. Liu, and X.X. Chang. 2012. The response of soil moisture to rainfall event size in subalpine grassland and meadows in a semi-arid mountain range: A case study in northwestern China's Qilian Mountains. J. Hydrol. 420:183-190.
10.1016/j.jhydrol.2011.11.056
17
Hillel, D. 1998. Environmental soil physics. Academic Press, San Diego, CA, USA.
18
Jung, K.H., Y.K. Sonn, S.O. Hur, K.H. Han, H.R. Cho, M.J. Seo, M.H. Jung, and S.Y. Choi. 2016. Hydraulic characteristics of arable fields in Korea and applicability of pedotransfer functions. Korean J. Soil Sci. Fert. 49(6):655-661.
10.7745/KJSSF.2016.49.6.655
19
Jung, Y.S., H.D. Sa, S. Kang, S.B. Oh, and J.S. Lee. 2015. Soil water characteristic curve using volumetric pressure plate extractor incorporated with TDR system. J. Korean Geotech. Soc. 31(8):17-28.
10.7843/kgs.2015.31.8.17
20
Kim, D.J., K.H. Han, Y.S. Zhang, H.R. Cho, S.A. Hwang, and J.H. Ok. 2019. Verification of reference evapotranspiration estimated by weighable lysimeters and its applicability. Korean J. Soil Sci. Fert. 52(3):284-296.
21
Kim, D.J., K.H. Han, Y.S. Zhang, H.R. Cho, S.A. Hwang, J.H. Ok, K.S. Choi, and J.S. Choi. 2018a. Evaluation of evapotranspiration in different paddy soils using weighable lysimeter before flooding stage. Korean J. Soil Sci. Fert. 51(4):510-521.
22
Kim, H.Y., C.K. Shin, Y.H. Park, and J.Y. Moon. 2018b. Water resources management in the Republic of Korea: Korea's challenge to flood and drought with multi-purpose dam and multi-regional water supply system. IDB Technical Note 1566, Inter-American Development Bank.
10.18235/0001532
23
Kim, J.Y. 2014. Efficient irrigation practice through soil moisture sensor based automated irrigation system in ornamental plant production. Flower Res. J. 22(2):48-53.
10.11623/frj.2014.22.2.2
24
Kim, M.J., H.Y. Kang, T.S. Oh, and J.S. Park. 2017. Drought status and outlook for 2017. Water for Future. J. Korea Water Resour. Assoc. 50(9):56-61.
25
Klammler, G. and J. Fank. 2014. Determining water and nitrogen balances for beneficial management practices using lysimeters at Wagna test site (Austria). Sci. Total Environ. 499:448-462.
10.1016/j.scitotenv.2014.06.00924982000
26
Lee, J.Y. 2012. A study of the application of an agricultural drought index considering climate change. Working Paper 2012-01, Korea Environment Institute, Seoul, Korea.
27
Li, H.D., W.S. Shen, C.X. Zou, J. Jiang, L.N. Fu, and G.H. She. 2013. Spatio-temporal variability of soil moisture and its effect on vegetation in a desertified aeolian riparian ecotone on the Tibetan Plateau, China. J. Hydrol. 479:215-225.
10.1016/j.jhydrol.2012.12.002
28
Li, J.H., L. Li, R. Chen, and D.Q. Li. 2016. Cracking and vertical preferential flow through landfill clay liners. Eng. Geol. 206(17):33-41.
10.1016/j.enggeo.2016.03.006
29
Liu, H., T.W. Lei, J. Zhao, C.P. Yuan, Y.T. Fan, and L.Q. Qu. 2011. Effects of rainfall intensity and antecedent soil water content on soil infiltrability under rainfall conditions using the run off-on-out method. J. Hydrol. 396:24-32.
10.1016/j.jhydrol.2010.10.028
30
Longobardi, A. 2008. Observing soil moisture temporal variability under fluctuating climatic conditions. Hydrol. Earth Syst. Sci. Discuss. 5:935-969.
10.5194/hessd-5-935-2008
31
MAFRA. 2019. Agriculture, food and rural affairs statistics yearbook. Ministry of Agriculture, Food and Rural Affairs. Sejong, Korea.
32
Meissner, R., H. Rupp, J. Seeger, G. Ollesch, and G.W. Gee. 2010. A comparison of water flux measurements: passive wick-samplers versus drainage lysimeters. Eur. J. Soil Sci. 61:609-621.
10.1111/j.1365-2389.2010.01255.x
33
Meißner, R., M.N.V. Prasad, G. Du Laing, and J. Rinklebe. 2010. Lysimeter application for measuring the water and solute fluxes with high precision. Curr. Sci. 99(5):601-607.
34
NAAS. 2010. Methods of soil chemical analysis. National Academy of Agricultural Science, Rural Development Administration, Suwon, Korea.
35
NIAS. 2017. Methods of soil physical analysis. National Institute of Agricultural Sciences, RDA, Wanju, Korea.
36
Ok, J.H., K.H. Han, Y.J. Lee, Y.S. Zhang, H.R. Cho, S.A. Hwang, S.S. Kim, J.H. Lee, and D.J. Kim. 2018. Water balance for Chinese cabbage in spring season with different upland soils evaluated using weighable lysimeters. Korean J. Soil Sci. Fert. 51(4):555-563.
37
Ok, J.H., K.H. Han, Y.S. Zhang, H.R. Cho, S.A. Hwang, and D.J. Kim. 2019. Weighable lysimeter study for water balance estimation of Chinese cabbage in the fall season. Korean J. Soil Sci. Fert. 52(4):325-333.
38
Penna, D., L. Brocca, M. Borga, and G. Dalla Fontana. 2013. Soil moisture temporal stability at different depths on two alpine hillslopes during wet and dry periods. J. Hydrol. 477:55-71.
10.1016/j.jhydrol.2012.10.052
39
Pereira, L.S., T. Oweis, and A. Zairi. 2002. Irrigation management under water scarcity: review. Agric. Water Manag. 57:175-206.
10.1016/S0378-3774(02)00075-6
40
Renard, K.G., G.R. Foster, G.A. Weesies, D.K. McCool, and D.C. Yoder. 1997. Predicting soil erosion by water: A guide to conservation planning with the Revised Universal Sol Loss Equation (RUSLE). Agriculture Handbook No. 730, United States Department of Agriculture, Washington, DC, USA.
41
Römkens, M.J.M., K. Helming, and S.N. Prasad. 2001. Soil erosion under different rainfall intensities, surface roughness, and soil water regimes. Catena. 46:103-123.
10.1016/S0341-8162(01)00161-8
42
Saccon, P. 2018. Water for agriculture, irrigation management. Appl. Soil Ecol. 123:793-796.
10.1016/j.apsoil.2017.10.037
43
Seo, M.C., S.O. Hur, Y.K. Sonn, H.S. Cho, W.T. Jeon, M.K. Kim, and M.T. Kim. 2012. The development of estimation model (AFKAE0.5) for water balance and soil water content using daily weather data. Korean J. Soil Sci. Fert. 45(6):1203-1210.
10.7745/KJSSF.2012.45.6.1203
44
Seo, M.J., K.H. Han, H.R. Cho, J.H. Ok, Y.S. Zhang, Y.H. Seo, K.H. Jung, H.S. Lee, and G.S. Kim. 2017. Interpreting in situ soil water characteristics curve under different paddy soil types using undisturbed lysimeter with soil sensor. Korean J. Soil Sci. Fert. 50(5):336-344.
45
Seo, M.J., K.H. Han, K.H. Jung, H.R. Cho, Y.S. Zhang, and S.Y. Choi. 2016. Effect of temperature and plow pan on water movement in monolithic weighable lysimeter with paddy sandy loam soil during winter season. Korean J. Soil Sci. Fert. 49(4):300-309.
10.7745/KJSSF.2016.49.4.300
46
Soil Survey Staff. 1999. Soil taxonomy: A basic system of soil classification for making and interpreting soil surveys, 2nd edition. Agriculture Handbook 436, Natural Resources Conservation Service, United States Department of Agriculture, Washington, DC, USA.
47
Song, Y.S. 2013. Estimation on unsaturated hydraulic conductivity function of Jumoonjin sand for various relative densities. J. Korean Soc. Civ. Eng. 33(6):2369-2379.
10.12652/Ksce.2013.33.6.2369
48
Tinker, P.B. and P.H. Nye. 2000. Solute movement in the rhizosphere. Oxford University Press, New York, USA.
49
Tuller, M. and D. Or. 2004. Retention of water in soil and the soil water characteristic curve. Encycl. Soils Environ. 4:278-289.
10.1016/B0-12-348530-4/00376-3
50
Unger, P.W. and T.A. Howell. 2000. Agricultural water conservation - A global perspective. J. Crop Prod. 2(2):1-36.
10.1300/J144v02n02_01
51
Wan, Y., Q. Xue, L. Liu, and L. Zhao. 2016. The role of roots in the stability of landfill clay covers under the effect of dry-wet cycles. Environ. Earth Sci. 75(71).
10.1007/s12665-015-4876-7.
52
Wan, Y., Q. Xue, L. Liu, and S.Y. Wang. 2018. Relationship between the shrinkage crack characteristics and the water content gradient of compacted clay liner in a landfill final cover. Soils Found. 58:1435-1445.
10.1016/j.sandf.2018.08.011
53
Yang, W., Y. Wang, C. He, X. Tan, and Z. Han. 2019. Soil water content and temperature dynamics under grassland degradation: a multi-depth continuous measurement from the agricultural pastoral ecotone in Northwest China. Sustainability. 11:4188. doi:10.3390/su11154188.
10.3390/su11154188
54
Zheng, D., E.R. Hunt Jr., and S.W. Running. 1993. A daily soil temperature model based on air temperature and precipitation for continental applications. Clim. Res. 2:183-191.
10.3354/cr002183
페이지 상단으로 이동하기