

Introduction
In South Korea, reclaimed tidelands (RTLs) have been constructed to create new land for enlarging arable land to ensure food security, and the area of RTLs is estimated to be 186,639 ha, which is equivalent to 11.7% of total arable land and 22.1% of rice cultivating land in 2018 (MOAF, 2019). The RTLs are often located in lowland with high groundwater level and high salinity, which inhibit growth of many upland plants (Lee et al., 2003a; Huang et al., 2008). In RTLs, rice (Oryza sativa L.) is commonly cultivated over other crops for two main reasons: firstly, rice is the most important staple food and secondly, rice is cultivated under waterlogged conditions and thus may has less salt stress due to leaching of excessive salt below rooting zone during growing seasons (Abrol et al., 1988; Lim et al., 2020). However, with reduction of rice consumption, there are increasing social pressures on the multi-purposes use of RTLs including production of other cereal and food except for rice (Kang et al., 2019).
Many studies have been conducted to test the suitability of a variety of crop species such as miscellaneous cereals (Kang et al., 2019), vegetables (Lee et al., 2003b), and forage (Shin et al., 2004) for cultivation in RTLs soils with a special consideration of soil salinity. The tested crops include corn (Zea maize L.), millet (Panicum miliaceum L.), sorghum (Sorghum bicolor L.), buckwheat (Fogopyrun esculentum L.), and soybean (Glycine max L) for miscellaneous cereals (Lee et al., 2003b; Lee et al., 2016; Kang et al., 2019); Chinese cabbage (Brassica campestris L.), radish (Raphnus raphanistrum L.), tomato (Solanum lycopersicum L.), lettuce (Lactuca sativa L.), beet (Beta vularis L.) and turnip (Brassica rapa L.) for vegetables (Lee et al., 2003b; Jo et al., 2018); sorghum (Sorghum bicolor L. Moench.)×sudangrass (Sorghum sudanense Piper), Italian ryegrass (Lolium multifiorum Lam.), and kenaf (Hibiscus cannabinus L.) for forage crops (Shin et al., 2004, Shin et al., 2005; Kang et al., 2018).
However, in salt-affected soils including RTLs in South Korea, not only soil salinity but also water salinity should be considered to evaluate crop growth and suitability in the soils (Eynard et al., 2005; Lim et al., 2020) as water salinity directly affects crop growth and also determines leaching requirement for the growth of a certain crop species to maintain soil salinity below a threshold level (Skaggs et al., 2012; Cucci et al., 2019). For example, even rice, which is widely cultivated in salt-affected soils, is known to be susceptible to water salinity stress; e.g., rice yield decreases when electrical conductivity (ECw) of irrigation water is > 2 dS m-1 and no yield is expected when ECw is 7.6 dS m-1 (Maas and Hoffman, 1977; Lim et al., 2020). In addition, as many upland crop species are sensitive to excess moisture stress and poor aeration, soil textures of the RTLs may be another barrier for cultivation of divergent crop species (Yamauchi et al., 2018).
Therefore, it is highly necessary to take water salinity and soil texture as well as soil salinity into consideration to evaluate the suitability of crop cultivations in RTLs soils. In this study, to provide a comprehensive methodology for selection of crop species suitable for RTLs and to recommend crop species suitable for 12 RTLs under national government’s management, the suitability of crop species to the RTLs was evaluated using soil and water salinity and soil texture.
Materials and Methods
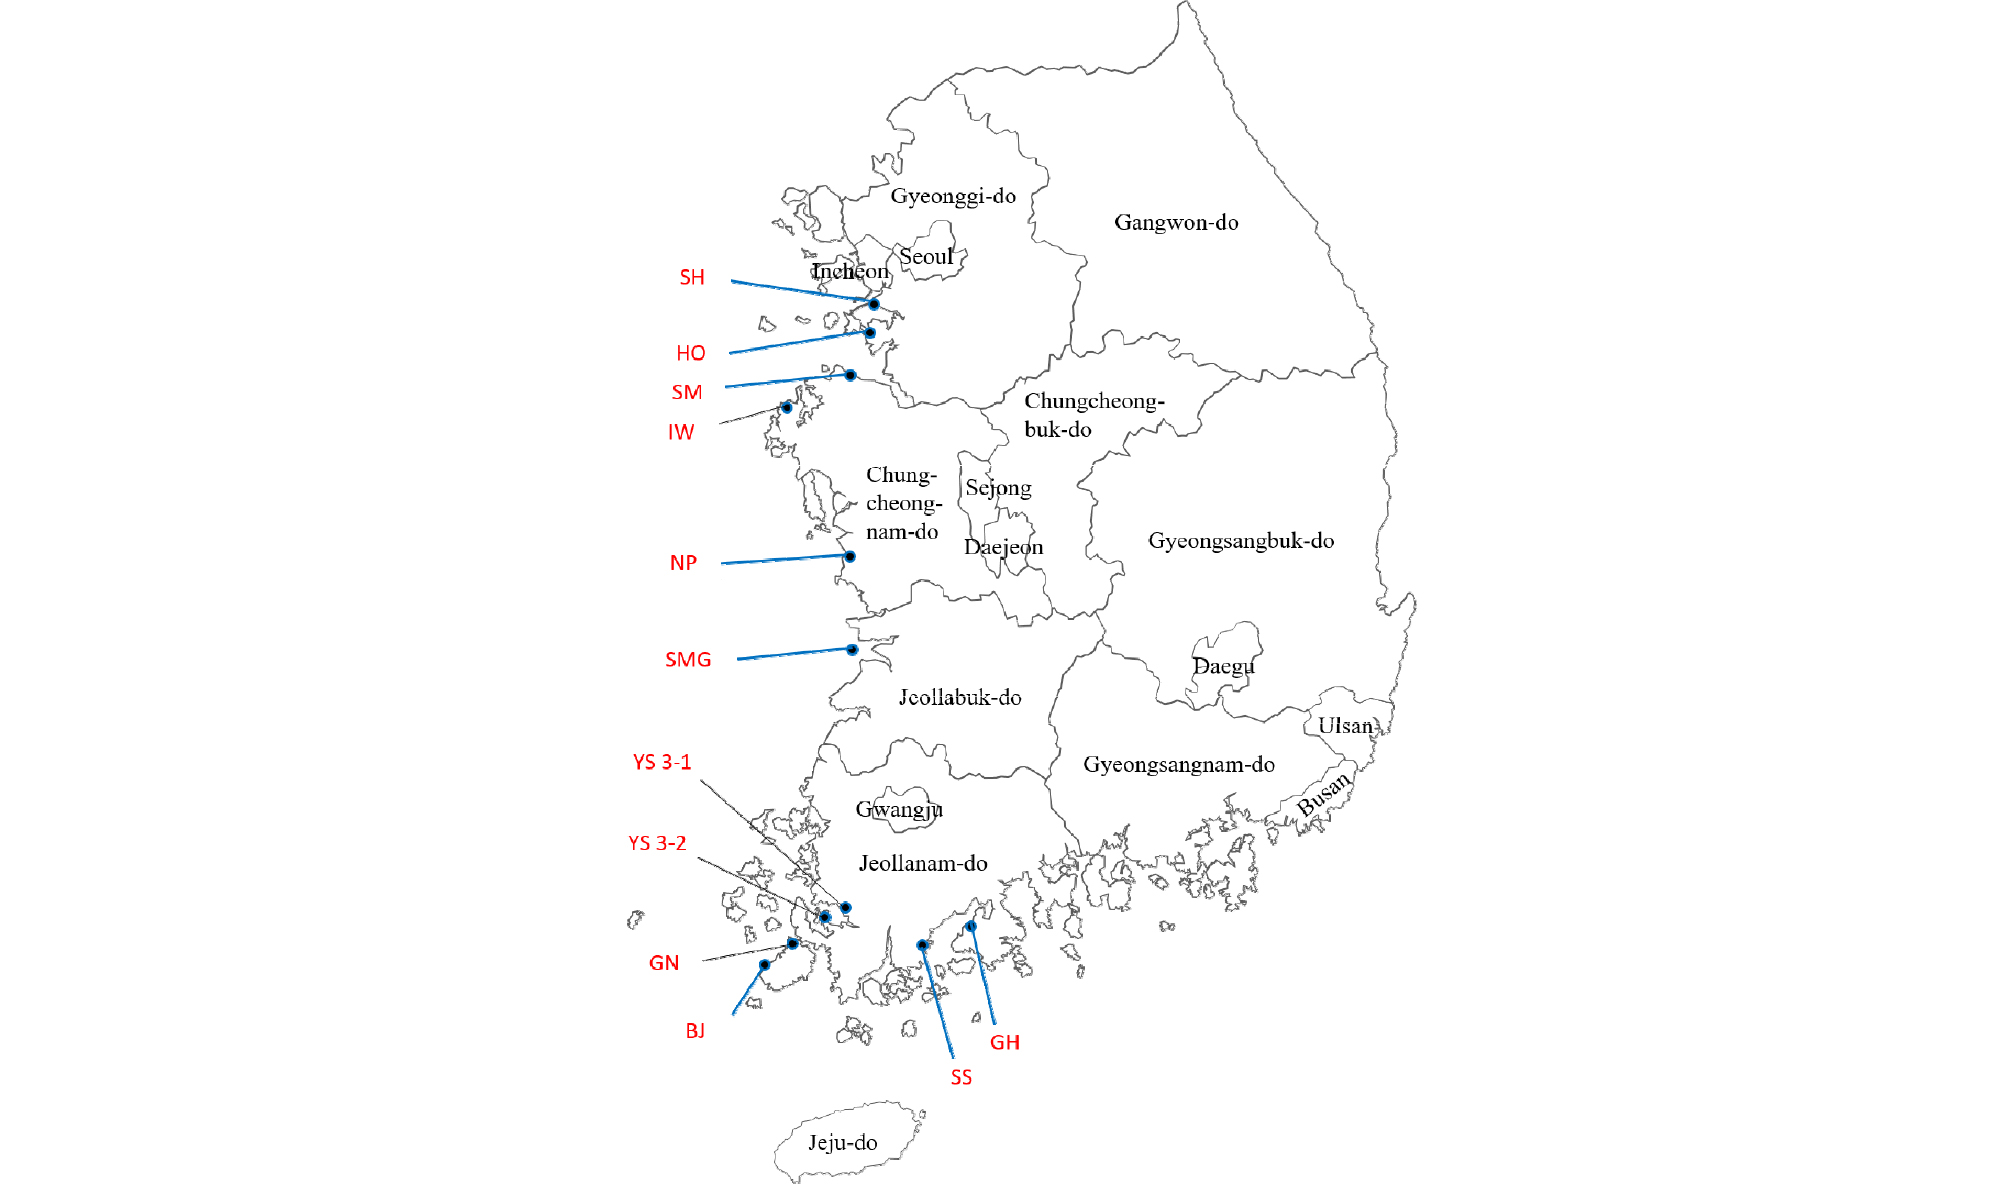
RTLs study sites and sampling This study was conducted with 12 RTLs soils under national government’s management: Bojeon (BJ), Goheung (GH), Gunnae (GN), Hwaong (HO), Iwon (IW), Nampo (NP), Sihwa (SH), Seokmoon (SM), Saemangeum (SMG), Samsan (SS), Yeongsangang 3-1 (YS 3-1), Yeongsangang 3-2 (YS 3-2) (Table 1 and Fig. 1). In the spring of 2018, surface soil (0 - 20 cm) samples were collected using soil augers from 3 - 10 fields for the RTLs considering the land area of the RTLs (Table 1). Water samples were collected from the estuary reservoir in the RTLs four times in the spring, middle summer (before monsoon season), late summer (after monsoon season), and fall (at harvest) (Table 1).
Table 1. The location and area of 12 reclaimed tideland (RTL) study site, number of soil sampling, and water sampling location.
Analyses of soil and water samples Soil samples were air-dried, passed through a 2-mm sieve, and used for analyses. Particle size distribution was determined using the pipette method (Gee and Bauder, 1986). For measurement of electrical conductivity of saturated soil paste (ECe), approximately 500 g of soil samples were placed into a plastic container, and distilled water was added until the soils reached a condition of complete saturation as described in the USDA Handbook 60 (US Salinity Laboratory Staff, 1954; Park et al., 2019). The extracts of saturated pastes were obtained under vacuum using a vacuum extractor (SampleTek 24VE, MAVCO INDUSTREIS, Inc., Kentucky, USA), and EC was measured using a conductivity meter (Orion 3 STAR, Thermo Fisher Scientific Korea, Seoul, Korea). Water samples were also analyzed for ECw using the conductivity meter.
Evaluation of the crop suitability Initially, we tested a total of 29 crop species, and the 10 crop species were selected with the consideration of the threshold soil and water salinity and soil texture suitability of crop growth in RTLs. Suitability of crop species to RTLs was evaluated through a scoring procedure (Table 2) using soil texture and soil and water salinity as parameters. Perfect scores for soil texture (20) and soil (40) and water (40) salinity were set to be the total sum is 100. The perfect scores (each 40) were allocated arbitrarily to soil and water salinity first considering the well-established data base of the effects of soil and water salinity on crop growth (Ayers and Westco, 1985; Abrol et al., 1988), and the remainder (20) was allocated to soil texture. The score allocation can be varied depending on the opinion of researchers; however, as the scoring compares relative suitability ranking amongst various crops, the results should not be different with the score allocation method in a certain RTL.
Table 2. Scoring procedure for the evaluation of crop suitability to reclaimed tideland soils using soil texture and soil and water salinity.
| Parameter | Perfect score | Scoring method | Reference |
| Soil texture | 20 | 20, if suitable 0, if not suitable | NAS (2017) |
| Soil salinity | 40 |
Scoring using the relationship between relative yield (Yr) of a specific crop and ECe, Yr = A ‒ ECe × f, where A is y-intercept and f is a crop yield reduction coefficient (Fig. 2 and Table 5). The equation was derived from the yield changes with ECe of Food and Agriculture Organization (Table 4). When ECe is the same as or below the threshold ECe, Yr becomes 100 and a perfect score (40) is given to soil salinity score. When ECe is above the threshold ECe, Yr (<100) is obtained from the equation and the salinity score is computed as 40 × (Yr/100); and if Yr is negative, zero is given to the soil salinity score. | Abrol et al. (1988) |
| Water salinity | 40 |
Scoring using the relationship between relative yield (Yr) of a specific crop and ECw, Yr = A ‒ ECw × f, where A is y-intercept and f is a crop yield reduction coefficient (Fig. 2 and Table 5). The equation was derived from the yield changes with ECw of Food and Agriculture Organization (Table 4). When ECw is the same as or below the threshold ECw, Yr becomes 100 and a perfect score (40) is given to water salinity score. When ECw is above the threshold ECw, Yr (<100) is obtained from the equation and the salinity score is computed as 40 × (Yr/100); and if Yr is negative, zero is given to the water salinity score. | Abrol et al. (1988) |
| Total | 100 | The sum of the scores of soil texture, soil salinity, and water salinity. |
For soil texture score, proper soil texture group for cultivation of crop species provided by NAS (2017) was used (Table 3); specifically, if the soil texture of a RTL is within the texture group, 20 was given and if soil texture is out of the texture group, the RTL was scored 0. For soil salinity score, the database of Food and Agriculture Organization on yield changes with ECe (Table 4, Abrol et al., 1988) was used. Using the database, the relationship between relative yield (Yr) of a specific crop and ECe (Table 4), an equation, Yr = A ‒ ECe × f, where A is y-intercept and f is a crop yield reduction coefficient, was developed for each crop (Fig. 2 and Table 5). When ECe is the same as or below the threshold ECe, Yr was assumed to be 100 that is equivalent to the perfect score (40) for soil salinity; and when ECe is above the threshold ECe, Yr (<100) is obtained from the equation and the salinity score is computed as 40×(Yr/100). Water salinity score was developed as the same as the soil salinity score. Total suitability score was calculated as the sum of the scores of soil texture, soil salinity, and water salinity.
Table 3. Soil texture group suitable for cultivation of the selected 10 crops.
Table 4. Soil (ECe) and water (ECw) salinity at a certain relative yield of crop species: example of the selected 10 crops.
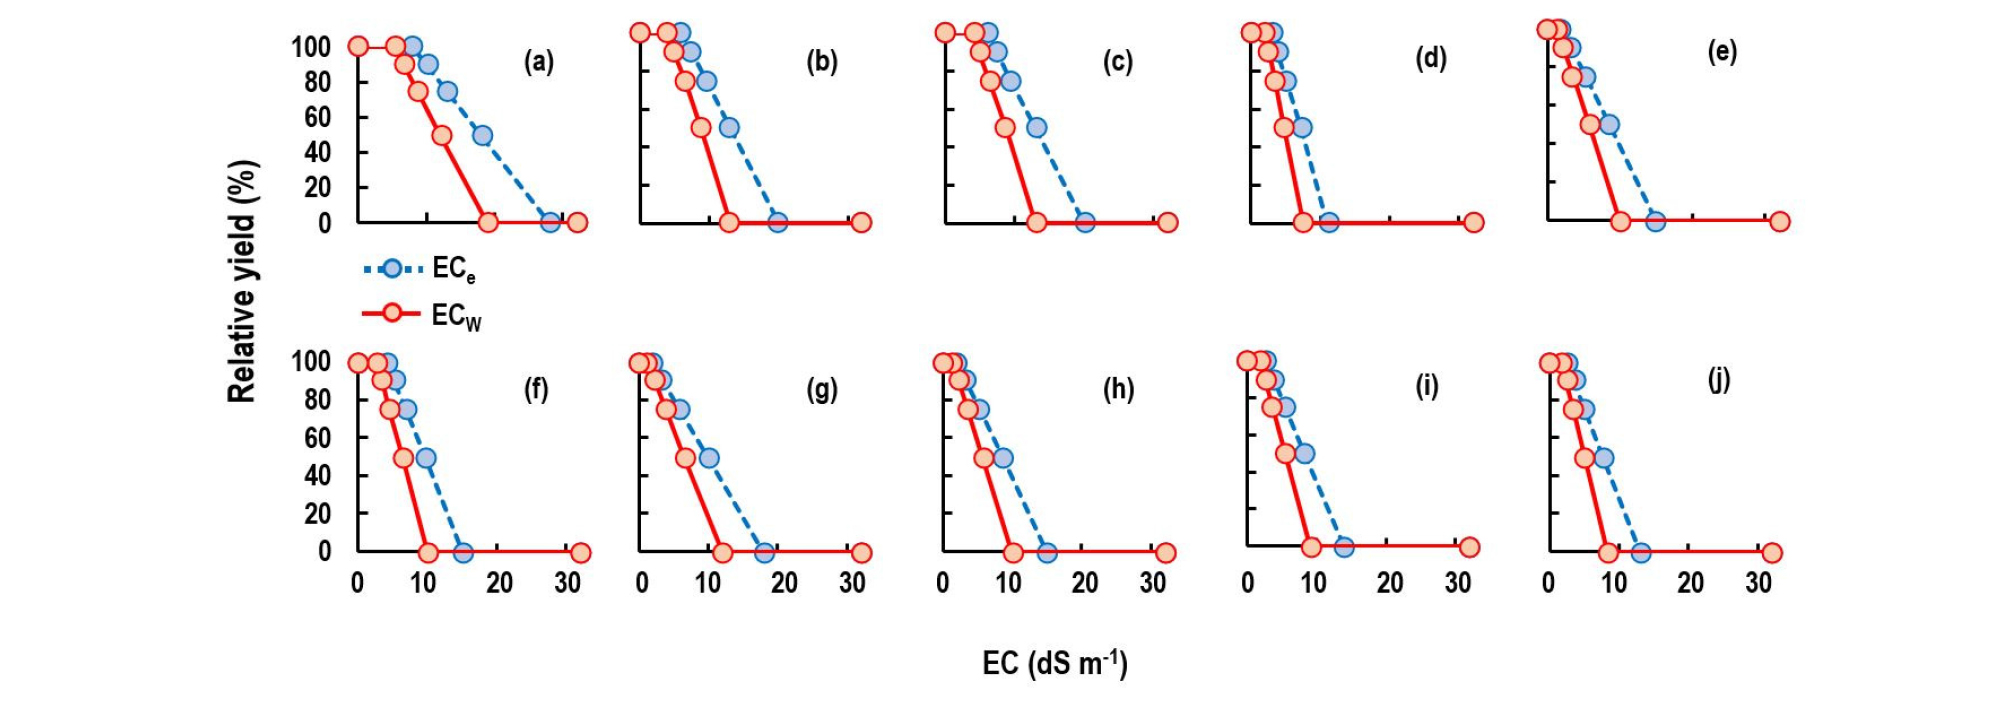
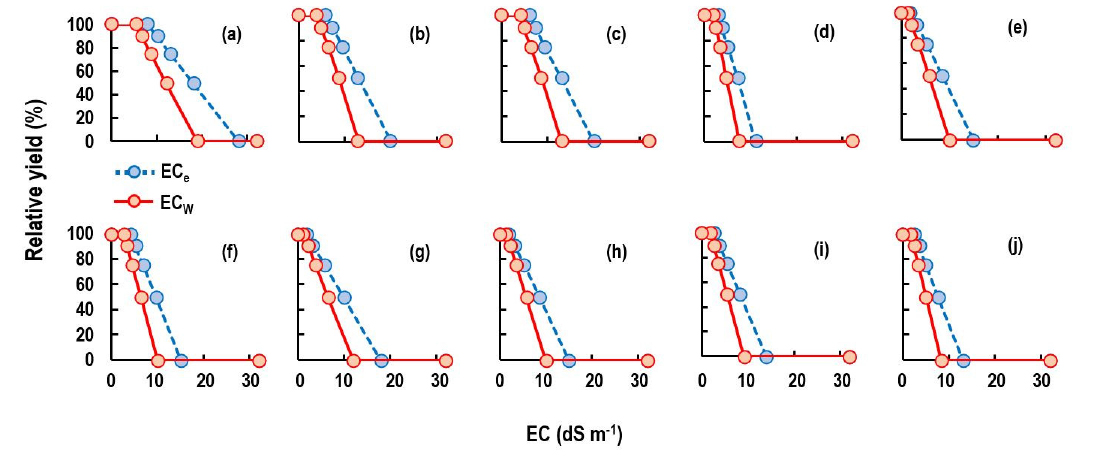
Fig. 2.
Change in relative yield of crop species with soil (ECe) and water (ECw) salinity: examples with 10 selected crops; (a) barley, (b) barley (forage), (c) wheat, (d) paddy rice, (e) maize (forage), (f) beet, (g) celery, (h) spinach, (i) broccoli, and (j) tomato. Data from Abrol et al. Lee(1998).
Table 5. Regression equations for the relationship of relative yields (Yr) of the selected 10 crops with soil (ECe) and water (ECw) salinity (x variables) using the data in Table 4.
†Application of the equations are described in Table 2.
Results and Discussion
Soil texture and soil and water salinity Soil particle size distribution varied largely within a RTL and across 12 RTLs soils (Fig. 3). For example, the mean % sand varied from 8.5% for GN to 82.4% for SMG, and among the 12 RTLs, IW, NP, and SMG RTLs had greater % sand than the others. The % clay varied within a narrow range from 3.2 to 31.6%. The representative soil texture determined with the average % clay, silt, and sand was loam for BJ, silt loam for GH, silty clay loam for GN, silt loam for HO, sandy loam for IW and NP, loam for SH and SM, sandy loam for SMG, silt loam for SS, silty clay loam for YS 3-1, and clay for YS 3-2 (Table 6).
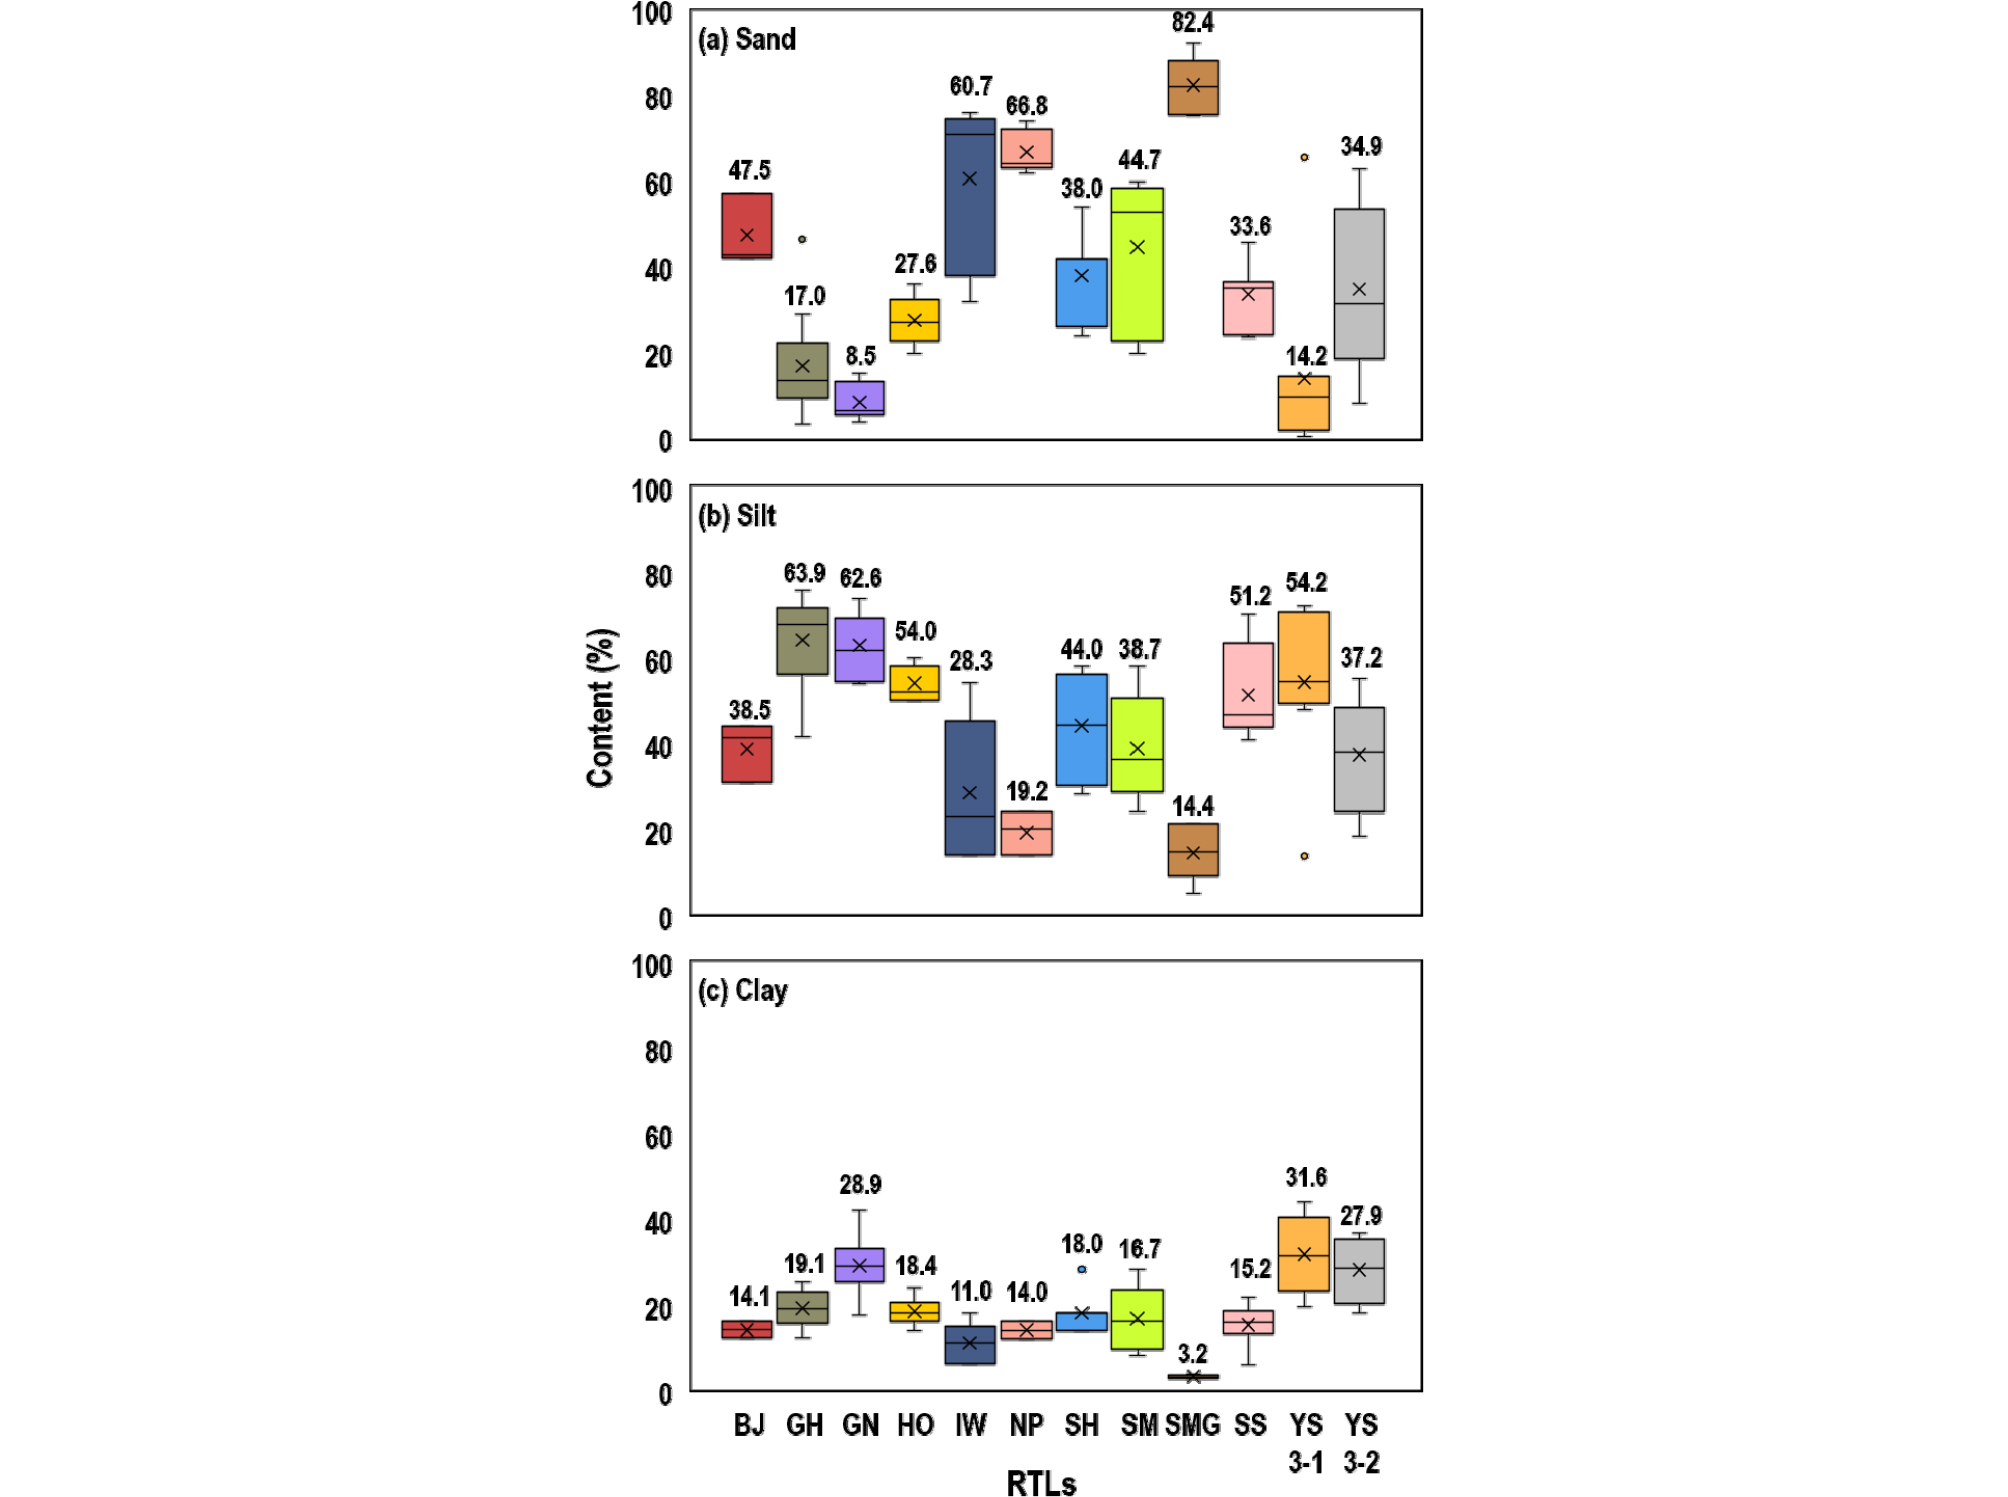
Fig. 3.
Box plots of the distribution of (a) sand, (b) silt, and (c) clay of the reclaimed tideland (RTL) soils. Average values are depicted for each RTL. Boxes represent interquartile ranges (IQRs) and horizontal lines within boxes indicate median values. The upper and lower whiskers indicate 75 percentile plus 1.5 IQR and 25 percentile minus 1.5 IQR, respectively. × is average value, and ○ is a mild outlier of which value > 75 percentile plus 1.5 IQR, but <75 percentile plus 3.0 IQR.
Table 6. Summary of soil texture and mean soil (ECe) and water (ECw) salinity of the 12 reclaimed tideland soils.
†Representative texture was determined with the average % distribution of clay, silt, and sand of the RTL soils.
The average ECe ranged widely from 1.2 dS m-1 for GH to 12.5 dS m-1 for SS (Fig. 4a). Soil salinity is classified into six categories based on the impacts of crop yield; non saline (ECe 0 - 2 dS m-1, salinity effect is negligible), slightly saline (ECe 2 - 4 dS m-1, yields of sensitive crops may be restricted), moderately saline (ECe 4 - 8 dS m-1, yields of many crops are restricted), strongly saline (ECe 8 - 16 dS m-1, only tolerant crops yield satisfactorily), and very strongly saline (ECe >16 dS m-1, only a few very tolerant crops yield satisfactorily) (Abrol et al., 1988; Francois and Maas, 1999). Therefore, according to the classification, GH is non saline, NP, SH, and SMG are slightly saline, and BJ, HO, IW, SM, and YS 3-2 are moderately saline, and GN, SS, and YS 3-1 are strongly saline.
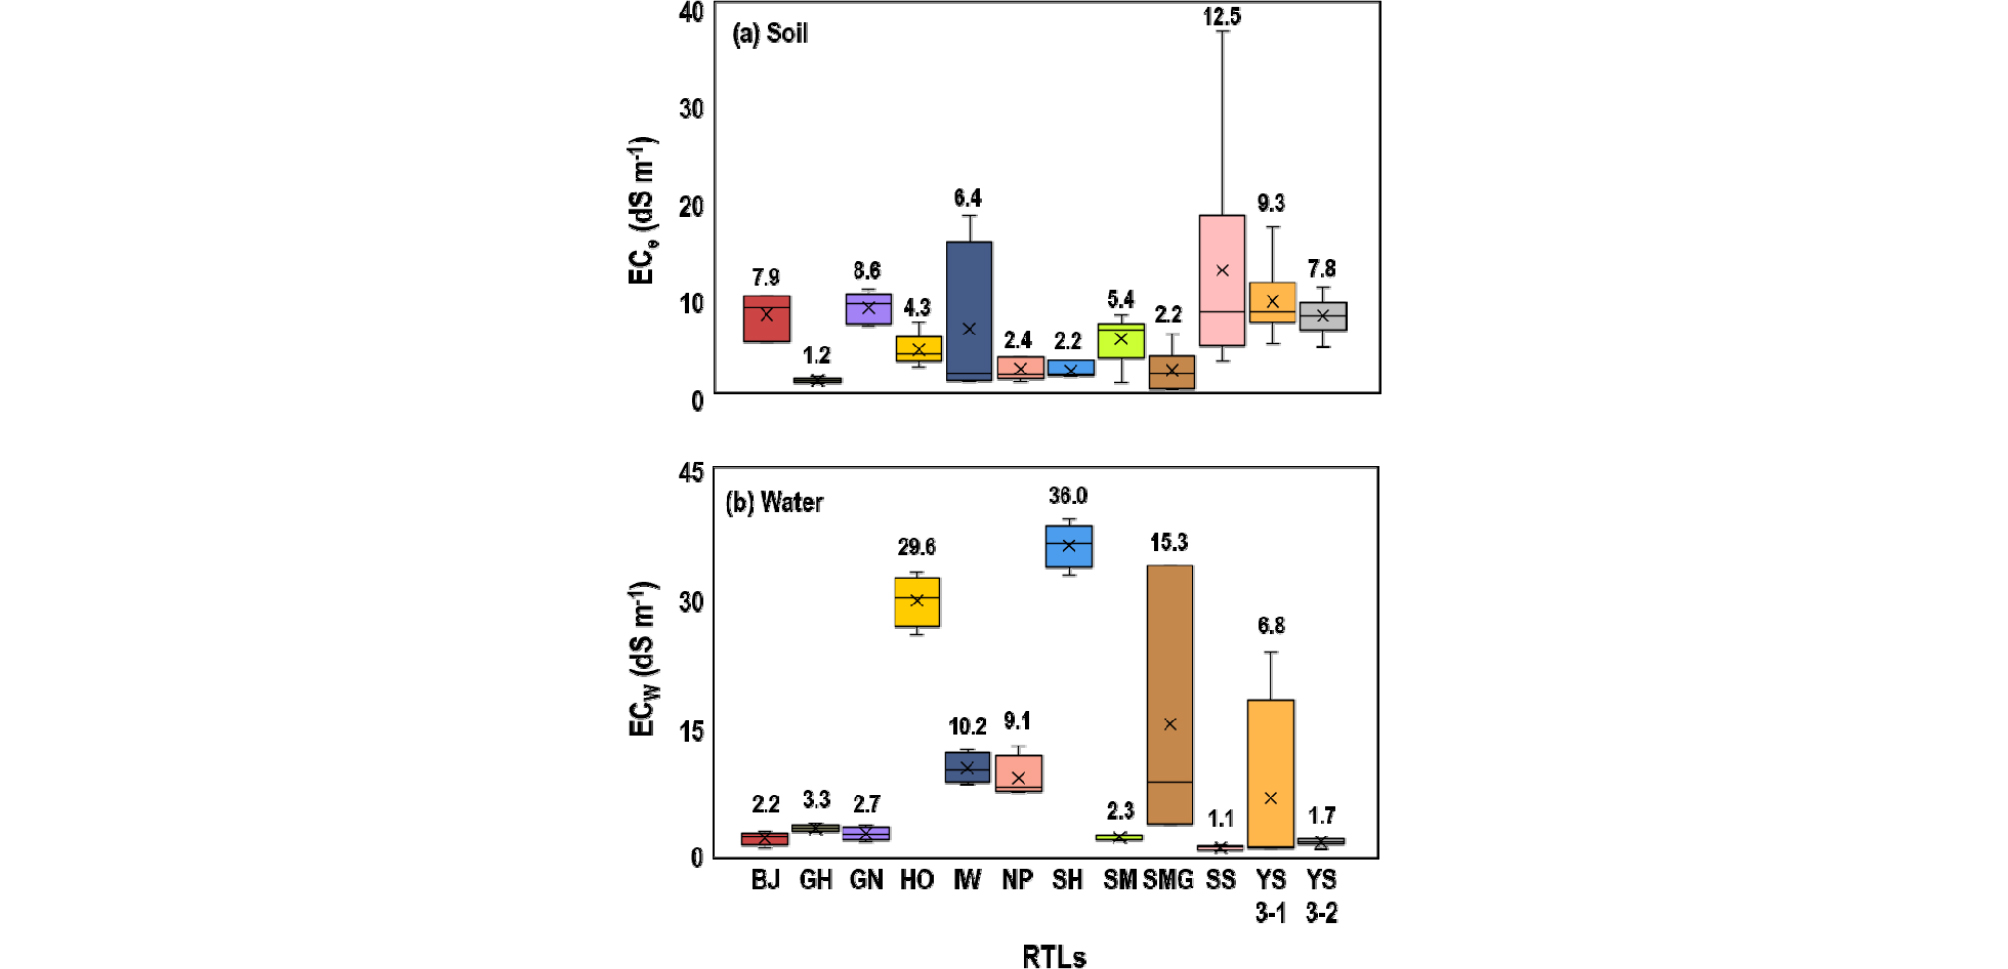
Fig. 4.
Box plots of the distribution of (a) soil salinity (ECe) and (b) water salinity (ECw) of the reclaimed tideland (RTL) soils. Average values are depicted for each RTL. Boxes represent interquartile ranges (IQRs) and horizontal lines within boxes indicate median values. The upper and lower whiskers indicate 7 percentile plus 1.5 IQR and 25 percentile minus 1.5 IQR, respectively. × is average value.
The average ECw ranged from 1.1 dS m-1 for SS to 36.0 dS m-1 for SH (Fig. 4b). Irrigation water quality is evaluated with many parameters including ECw, sodium adsorption ratio, and specific ions concentration such as Na, Cl, and B (Ayers and Westcot, 1985). Based on ECw, the degrees of the restriction on use of the water can be classified into three categories; none restriction for ECw <0.7 dS m-1, slight to moderate degree for ECw 0.7 - 3.0 dS m-1, and severe degree for ECw >3.0 dS m-1 (Ayers and Westcot, 1985). Therefore, according to the classification, agricultural water in BJ, GN, SM, SS, and YS 3-2 can be used for irrigation with slight to moderate restriction; whereas for the others, severe restriction is required. Taken soil and water salinity together (Table 6), GH is expected to be more suitable for crop growth than other RTLs, and soil salinity may be the limiting factor for crop growth in BJ, GN, SM, SS, and YS 3-2, whereas water salinity for NP, SH, and SMG and both soil and water salinity for HO, IW, and YS 3-1.
Crop suitability By using not only soil salinity, but also soil texture and water salinity as scoring parameters, it was possible to make sophisticated score being different among crop species. For example, in GH, all the crops had perfect score (40) for soil salinity, but scores for soil texture and water salinity differed, resulting in different total score (Table 7). If soil salinity was used as single parameters, therefore, it would result in the same suitability score for the 10 crops. Overall, among the 12 RTLs, BJ, GH, and SM had relatively higher suitability score than others due to lower ECw (for BJ and SM) or lower ECe (for GH); whereas HO and SM, which had higher ECw as well as YS 3-1 with moderate ECe and ECw but finer texture (silty clay loam) showed the lower score compared to other RTLs (Table 7).
Table 7. Ranking of crop suitability score for cultivation in 12 reclaimed tideland soils using soil texture and soil and water salinity.
If the score was the same, crops were listed in alphabetical order.
†Information of RTLs are provided in Table 1.
†Total score.
§Score for soil texture, soil salinity (ECe), and water salinity (ECw), respectively.
Among the crops, barley and wheat (winter crops) were high ranked due to their high tolerance to soil and water salinity (Table 4) as well as wide suitability to soil texture (Table 3). Compared to other summer crops, when soil texture was suitable, beet, celery, and maize were high ranked due to their salinity tolerance at a higher salinity range (Table 4). Though paddy rice is currently widely cultivated in the 12 RTLs under waterlogged conditions through continuous irrigation that allow leaching of excessive salts during rice growth (Lim et al., 2020), the suitability score was <70 in nine RTLs except for BJ, GH, and SM mostly due to high ECe and ECw. As shown in Table 4, rice is not tolerant to salinity stress, and thus rice yield is reported to decrease ECe above 3.0 dS m-1 and loses 50% yield at 6 - 7 dS m-1 (Maas and Hoffman, 1977; Abrol et al., 1988). For RTLs in South Korea, Lim et al. (2020) reported that white rice yield decreased with increasing salinity in an exponential manner.
As rice is a staple food in South Korea, the important role of RTLs to produce rice should not be ignored, and thus it is suggested to cultivate rice in three RTLs (BJ, GH, and SM) with high (>70) score for rice as a summer crop (Table 7). However, in the remaining nine RTLs, other crops such as beet (BJ, IW, NP, and YS 3-2), celery (BJ, IW, NP, and YS 3-2), and maize (GN, SS, and YS 3-1) are suggested as summer crops. For winter crops, barley (including forage) and wheat are suitable for all the RTLs.
Conclusion
This study shows that not only soil salinity but also soil texture and water salinity are necessary to be considered for the evaluation of crop suitability for cultivation in RTLs. Unexpectedly, the suitability score of rice was low for some RTLs and many other crops was ranked higher than rice. Therefore, in such RTLs, it may be possible to consider other crops including beet, celery, and maize as alternative summer crops to rice. For winter crops, barley and wheat were highly suitable for all RTLs. In addition, it may be also possible to increase crop yield by ameliorating soil texture, soil salinity, and water salinity for the target crops. However, in this study, as crop suitability was evaluated using average data of soil texture and salinity from selected fields in each RTL, it is necessary to use the data set specific to a field to recommend suitable crops for each field considering heterogeneity of soil properties among fields in a RTL. Furthermore, as soil and water salinity may decrease with time through natural and artificial desalinization, crop suitability assessment should be updated in the future to reflect changed soil and water salinity.
