

Introduction
The stability and composition of soil organic carbon (SOC) has received much attention due to its key role in carbon (C) cycling in terrestrial ecosystems (Campbell et al., 1999; Fageria, 2012). It is intimately associated to soil functions, such as enhancing soil aggregation, increasing nutrient supply, water retention and being a substrate for soil microorganisms (Duru et al., 2015; Hernandez et al., 2016; Das et al., 2017). However, despite the importance of SOC, its decrease is inevitable under agricultural activity (Duval et al., 2016; Lee et al., 2019). To mitigate this problem, organic fertilizer (OF) has been strongly recommend to enhance SOC content as well as affect SOC quality depending on amendment types.
Soil organic carbon consists of various compounds, from simple to more complex molecules which have different stability (Kosobuchi and Buszewki, 2011). Humic substance (HS) are the main component of soil organic matter (SOM) and the essential indices of soil fertility influencing crop productivity. The level of humification of organic material could be determined by several indicators, among which (a) the ratio of carbon and nitrogen (C/N ratio), (b) Humic Acid/Fulvic Acid (HA/FA) ratio (c) the humification rate (HR) (Tavares and Nahas, 2014; Putra et al., 2016).
It has been recognized that it is difficult to detect SOC changes induced by agricultural practices using total SOC measuring. Therefore, investigating labile carbon pools, rapidly changing SOC pools, is often used to assess soil quality (Ghani et al., 2003; Duval et al., 2018). Labile organic matter is mainly from the breakdown of crop residues, root exudates, and deceased microbial biomass, thus addition of organic matter such as organic fertilizer will likely increase labile organic carbon (Gattinger et al., 2012).
Numerous studies have reported that changes in carbon sequestration potential and dynamics were induced by soil management practices, such as reduced tillage (Wang et al., 2012), and also fertilization practices (Wang et al., 2012; Pramanik and Kim, 2014). Although it has been well documented that OFs improve soil fertility and crop productivity, our understanding of the different SOC fraction patterns influenced by different OFs is lacking. Thus, our study aimed to identify effect of different organic fertilizers (rice straw, cow manure compost and swine manure compost) to increase SOC stock and change SOC fractions in rice paddy soil. The objectives of this study were as follows: (i) to determine SOC stock with bulk density and SOC content, (ii) to characterize water extractable C, hot water extractable C content and humification rate under different organic matter application and soil depth and (iii) to evaluate the relationships between SOC fractions.
Materials and Methods
Field Management
The experiment was conducted at field station of rural development administration and established in March 2014. The experiment has five treatments arranged in randomized blocks with three replicates. The treatments are: inorganic fertilizer (NPK), NPK+Rice straw (NPK+RS), NPK+Cow compost (NPK+CC) and NPK+Swine compost (NPK+SC). Aside from fertilization treatments, control plot was added with no fertilization for comparison.
The recommendation rates (N-P2O5-K2O=90-45-57 kg ha-1) of chemical fertilizers were applied in all treatment except control plot (RDA, 2010). Composts were incorporated at 6, 12 and 2.6 Mg ha-1 of rice straw, cow compost and swine compost, respectively, two weeks before rice transplanting. The properties of OF materials were not significantly different during five years of rice cultivation, thus characteristics of material used for 2018’s experiment were shown in Table 1.
Table 1. Chemical properties of organic amendment used for this study.
Soil Sampling and Carbon Stock Calculation
The first soil sampling was conducted in 2014. Soil samples were collected from different depths: the top 0 - 10, 10 - 20 and 20 - 30 cm depth to quantify carbon content after harvest. Undisturbed samples were collected using a steel core (diameter: 7.5 cm, height: 7.5 cm) to determine soil bulk density, and obtained soil dry weight (105°C).
The C stocks were calculated according to (Eq. 1):
| $$\mathrm C\;\mathrm{stock}\;=\;\mathrm{SOC}\;\times\;\mathrm{BD}\;\times\;\mathrm{Soil}\;\mathrm{depth}$$ | (Eq. 1) |
where C is the carbon content (%), BD is the soil bulk density (kg m-3) and layer depth is the thickness (m).
Water Extractable Carbon and Hot Water Extractable Carbon
The water extractable carbon (WEC) was determined with fresh field soil samples by a modified method of Ghani et al. (2003) as follows. Briefly, the samples were mixed with distilled water (soil: solution ratio = 1:10) in tubes, shaken for 1 hour, centrifuged for 20 minutes at 3750 rpm. The supernants were filtered with 0.45 µm membrane filters to obtain total WEC. Filters were pre-rinsed with ultrapure water and flushed with air to avoid any release during filtration. Hot water extractable carbon (HWEC) was subsequently extracted at 80°C for 16 hours. A further 30ml of distilled water was added to the sediments remaining. The tubes were shaken for 10 seconds on a vortex shaker to suspend the soil in the water. They were placed in hot water bath at 80°C for 16 hours. After this step, the tubes were shaken for 10 seconds in a vortex shaker and centrifuged for 20 min at 3,500 rpm. The supernatants were filtered using 0.45 µm membrane filters and C concentration was determined on a TOC-5050A analyzer (Shimadzu Corporation, Japan).
Humic and Fulvic Acid0.1 N HCl was added in 3 g of air-dried soil to remove free carbonates. HA and FA fractions were extracted following the procedure described by Schnitzer (1982). Briefly, each sample was oven-dried at 70°C, shaken with 30 ml of 0.5 N NaOH for 21 h, centrifuged at 3,000 rpm for 30 min to separate the supernatant solution containing HA and FA. Fulvic acid (acid soluble fraction) was separated from HA (non-acid soluble fraction) by acidifying the alkaline supernatant with 2 N HCl for 24 h, and by centrifuging as explained above. Concentration of organic carbon in each fraction was determined following the Walkley-Black method (Nelson and Sommers, 1982).
Humification rate was measured from a percentage of the amount of humic acid and fulvic acid with total soil C-organic (3), with the following formula (Ciavatta et al., 1990; Putra et al., 2016)
| $$\mathrm{Humification}\;\mathrm{rate}\;(\mathrm{HR})\;\%\;=\;\lbrack{\mathrm C}_{\mathrm{HA}+\mathrm{FA}}\;/{\mathrm C}_{\mathrm{org}}\rbrack\;\times\;100\%$$ | (Eq. 2) |
Soil Chemical and Statistical Analysis
The chemical properties were analyzed using the Korean standard method (RDA, 1995). Soil pH (1:5 with H2O) was measured by pH meter. Soil organic matter content was determined by tyurin method. Total C and N content and nutrient properties were analyzed using an elemental analyzer (CHNS-932 Analyzer, Leco, USA) and inductively coupled plasma spectrometry (OPTIMA 4300DV, PerkinElmer, USA). Available phosphate concentration was determined by the Lancaster method.
The Pearson correlation coefficients were calculated using R software to determine the linear relationship between carbon fractions. One-way analysis of variance (ANOVA) was carried out on concentration of different carbons fractions, properties of OFs and crop productivity.
Results and Discussion
Soil Organic Carbon Stock
Table 2. showed SOC content, bulk density and SOC stock under 5 years of different organic fertilizer application. Application of OFs significantly increased SOC concentration by 7 - 12% and 26 - 33% over the NPK and control, respectively. Although both NPK and control did not have additional carbon input, there was significant difference between them. It might be due to the consecutively increased rhizodeposition, root biomass and stubble return by increased rice plant biomass (Ding et al., 2007; Lin et al., 2009). The highest SOC content (10.52 g kg-1) was found in NPK+CC and NPK+SC. Organic fertilization decreased bulk density by 2 - 6% and 11 - 14% compared to NPK and control, which indicated the improvement of soil quality.
Table 2. Soil organic carbon (SOC) content, bulk density and SOC stock under different fertilization.
†RS: Rice straw compost; CC: Cow manure compost; SC: Swine manure compost.
†SOC: Soil organic carbon.
The quality of organic fertilizer could influence on SOC stability (Kim et al., 2012; Hwang et al., 2017). Livestock compost is recognized to be relatively higher in quality, due to its high N contents, low C/N ratios, and low phenol/ lignin contents. Straw which has relatively low N contents, high C/N ratios, and large amounts of recalcitrant compounds such as lignin, might have capacity to sequester SOC. It is consistent with our finding that NPK+RS showed high SOC content and the lowest bulk density value. The highest SOC stock (39.16 kg C ha-1) was observed in NPK+SC which was enhanced by 5 and 17% over NPK and control, respectively.
Water Extractable Carbon and Hot Water Extractable Carbon
Different OF types and soil depth had significant effect on the WEC and HWEC (Fig. 1). However, there was no strong soil depth effect on both WEC and HWEC, for example, with the lowest WEC values in 30cm for NPK+RS (329 mg kg-1) but the highest in 30 cm for NPK+SC (465 mg kg-1) (Fig. 1). The range of each measurement in showed considerable range between minimum and maximum values. These reflect variations between the treatment and between the soil depth.
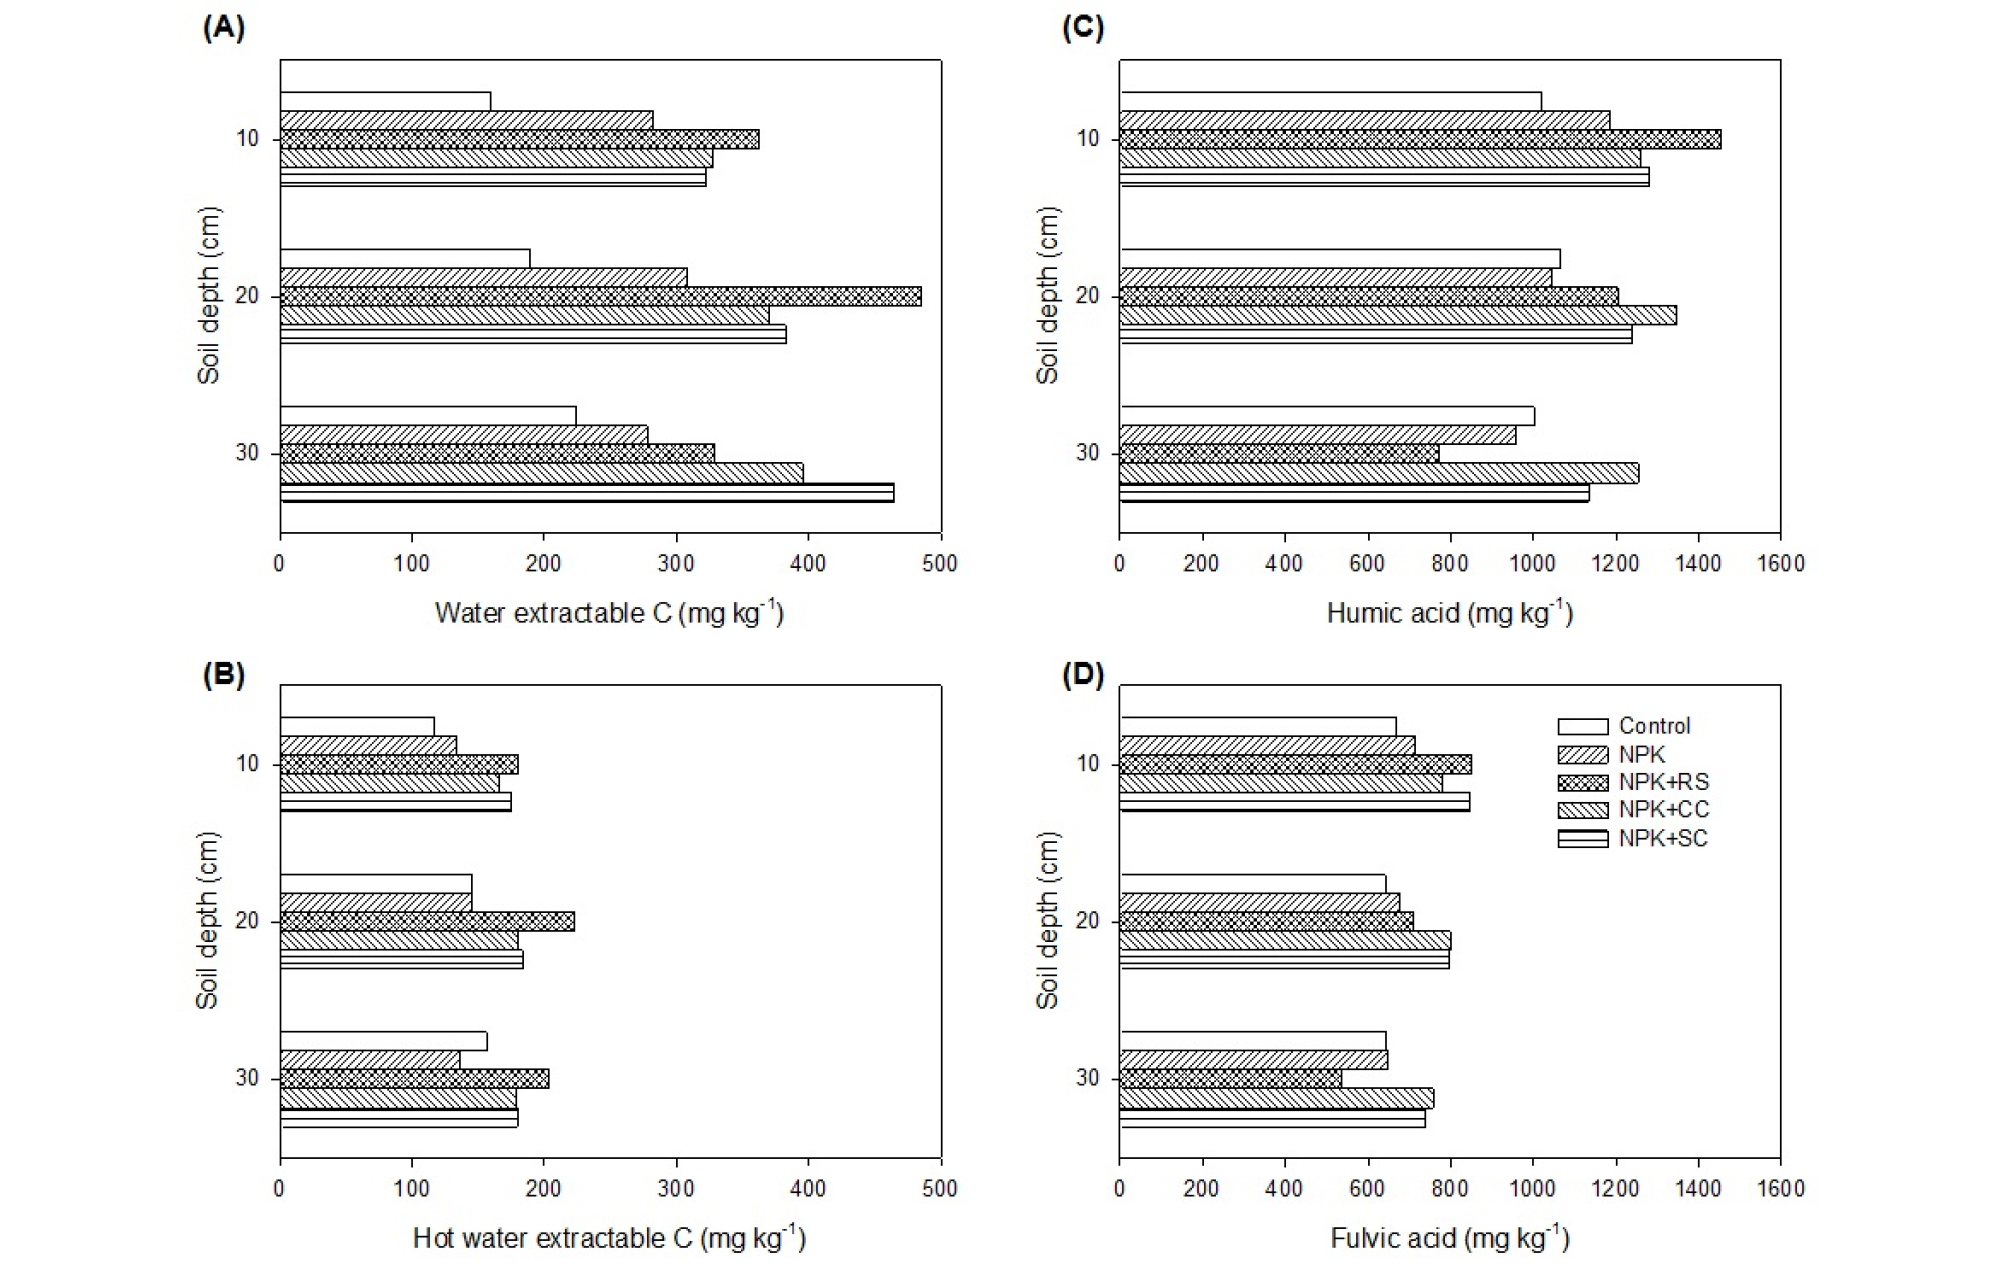
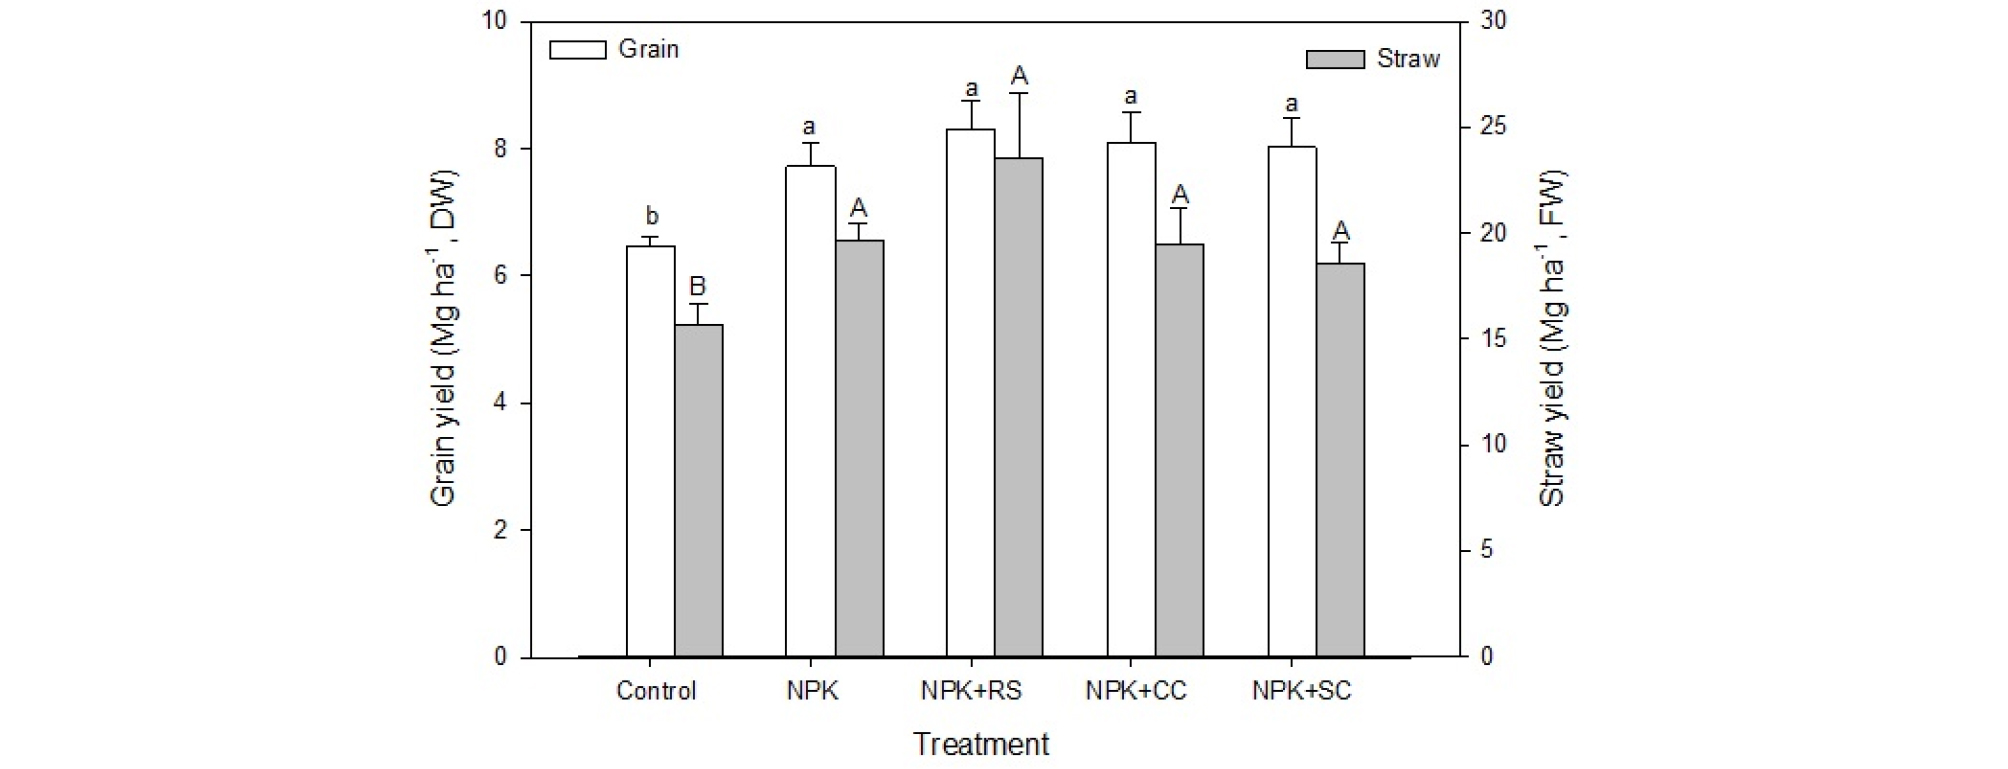
The OF application considerably increased WEC content by more than 30% and 90% over NPK and control, respectively, which is possibly attributed to a large amount of organic compound in OFs. No significant difference was found among OF treatments. Total C concentration was much higher in WEC, compared to HWEC. The content of HWEC was higher in order: NPK+RS > NPK+SC >NPK+CC > NPK > Control. This patterns are same with WEC concentration. The WEC and HWEC, considered as labile SOM fractions, are moderated with nutrient mineralization and can mainly contribute to nutrient availability and crop biomass production. Increased labile SOM originated from organic fertilizer led to augmentation of rice yield as shown in Fig. 2.
Humic and Fulvic Acid Fractions
The determination of the humic acid (HA) and fulvic acid (FA) contents can provide an estimate for a process of SOM humification. The OFs application increased HA content by 8 - 21% and 11 - 25% over only NPK and control treatment, respectively (Fig. 1). The rate of HA increase was similar with cover crop application impact as 11 - 28% (Arlauskiene et al., 2010). The highest HA value, 1,287 mg kg-1 at average of 0 - 30 cm, was found in NPK+CC treatment. After that, it was higher in order of NPK+SC (1,217 mg kg-1), NPK+RS (1,144 mg kg-1), NPK (1,063 mg kg-1) and control (1,029 mg kg-1). In case of FA, NPK+SW plot showed highest content, then it was 17 - 22% of increases over NPK and control. the distribution of FA content by soil depth decreased with the depth of soil, such as HA.
Both HA and FA concentration decreased with increasing soil depth in forest soil (Tavares and Nahas, 2014), however in our study, except NPK+RS treatment, significant difference depending on the soil depth was not observed. It might be related to soil disturbance leading to greater homogeneity. Except at 10 cm of soil depth, the highest HA and FA was found in NPK+CC treatment at other soil depths (Fig. 1).
Humification rate (HR) significantly increased from the surface layer to the other soil layers, confirming the findings of Favoreto et al. (2008). The difference in HR by soil depth was the largest in the NPK+RS treatment, for example decrease of 29% and 56% were found at 10 - 20 cm and 20 - 30 cm, respectively. It is assumed that humification is more intense in the presence of organic residues (Tavares and Nahas, 2014). Therefore, in control treatment less HR was observed in surface soil (Table 3).
Table 3. Total organic carbon, humic acid and fulvic acid contents of the soils with different amendment and soil depth.
†RS: Rice straw compost; CC: Cow manure compost; SC: Swine manure compost.
†SOM: Soil organic matter.
§HA: Humic acid; FA: Fulvic acid.
The value of HA/FA ranged from 1.44 to 1.71 in all treatments and all soil depths (Table 3). The proportion of HA to SOM ranged from 6.07 - 9.17% at 0 - 10 cm, 6.21 - 9.03% at 10 - 20 cm and 3.78 - 7.04% at 20 - 30 cm of soil depth. These values were 1.4 - 1.7 times higher than proportion of FA to SOM, regardless of treatment and soil depth. The deeper the soil, the smaller proportion of HA and FA to SOM, except control treatment.
Grain and Straw Yield
All OFs application increased grain yield by 4 - 8% and 24 - 29% over only chemical fertilization and control treatment, due to their higher content of total N. The highest grain and straw yield were observed in NPK+RS treatment (Fig. 2), but there is no significant difference between NPK and NPK plus OFs treatments.
Correlation Between Carbon Fractions
The Pearson correlations between values of SOC fractions are shown in Table 4. Soil organic carbon stock showed significant negative correlation with bulk density (p < 0.001) and positive correlation with FA/SOM, WEC (p < 0.001) and HR, grain yield (p < 0.01). It was also slightly correlated with HWEC, grain and straw yield (p < 0.05), indicating key role of SOM on soil quality. Although, there was distinct correlation between HA and FA (p < 0.01), they showed different relationship with other variables. The HA showed highly positive correlation with HA/FA ratio, HR, HA/SOM (p < 0.001) and FA/SOM (p < 0.01), while FA showed positive correlation with HR, FA/SOM (p < 0.001), HA/SOM (p < 0.01) and WEC, HWEC (p < 0.05). There was no correlation between WEC and HWEC, but both of them were correlated with SOM, bulk density, FA and FA/SOM, even significance degree was different (Table 4).
Table 4. Pearson correlation coefficient among soil organic carbon fractions and rice productivity.
†SOC: Soil organic carbon.
§HA/FA: Ratio of humic acid content and fulvic acid content.
¶HR: Humification rate.
∮HA/SOM and FA/SOM: Proportion of humic acid to SOM content and Proportion of fulvic acid to SOM content.
∫WEC and HWEC: Water extractable carbon and hot water extractable carbon.
Conclusion
Soil carbon content and fractions were enhanced by organic fertilization, which led to higher crop biomass yield. The interaction between different carbon fractions were found, and SOC and bulk density could be considered as key factors to affect other carbon fractions. Livestock manure (Cow manure compost and Swine manure compost) was more effective to increase SOC stock than rice straw compost, while RS showed the lowest bulk density. Therefore, application of organic fertilizer could be a reasonable soil management method to improve soil quality and increase rice yield in paddy soil.
