

Introduction
Plants living on the planet necessarily require the essential elements for optimal growth and development. They are divided into two groups according to the requirement (amounts in plants); macro (N, P, K, Ca, Mg, and S), micro (Cu, Zn, Fe, Mn, B, Mo, Cl, and Ni) and beneficial (Na, Co, Al, Se, and Si) (Marschner, 2011). Like macronutrients, micronutrients are also directly or indirectly employed in energy metabolism, primary and secondary metabolism, cell protection, gene regulation, hormone perception and signal transduction in most of plant species as well (Hänsch and Mendel, 2009). The deficient symptoms caused by micronutrients rarely occurs in agricultural practices due to relatively low requirement for plant growth, and, rather, the stress expressed as a toxicity, is sometimes caused by excess concentrations (Cu, Zn, Fe, and Mn) in soil.
The prominent visible symptoms of micronutrients take place in upper growing leaves, due to low uptake and mobility, as a chlorosis or tip-burn. Response to micronutrient, Cu, Zn, Fe and Mn, of plants is expressed in a variety of different ways; immobilization, exclusion, chelation and compartmentalization and closely involved in organic and amino acid metabolism (Cobbett, 2000). The shortage of boron (B) mainly causes sugar transport from source to sink and cell wall synthesis in meristematic tissues, and molybdenum (Mo) starvation affects N and S metabolism (Hänsch and Mendel, 2009).
Metabolomics is a powerful tool to comprehensively explain how metabolic networks are regulated and has been applied by many studies in recent years. The metabolic changes caused by higher metal ions expressed as a toxicity and other micronutrients have been broadly studied in many plant species (Rai, 2002; Roessner et al., 2006; Sharma and Dietz, 2006; Jahangir et al., 2008; Rellán-Alvarez et al., 2011). However, there is little information about how limited micronutrients affect primary metabolism.
Cabbage plant is one of important vegetable crops in east Asia including Korea, and requires relative higher amounts of fertilizer for favorable growth and harvest. Higher nutrient needs could be considered as a vulnerability on limited nutrient condition. In the previous study, macronutrients-deficient metabolic changes in cabbage plant were observed (Sung et al., 2018). Here, taken together the myriad effects of micronutrient deficiency as described above, an author hypothesized that the homeostasis of mineral nutrients is highly regulated at the whole plat level, and thus carbon and nitrogen metabolism is likely strongly influenced by unfavorable micronutrient condition for optimal crop growth. To verify this hypothesis, an author analyzed the levels of primary metabolites from the shoots and roots of cabbage plants grown under limited micronutrient conditions, and focused on explaining micronutrient-specific variations in primary metabolites and the shoot-root communication caused by micronutrient deficiency.
Materials and Methods
Plant Materials and Growth Conditions Cabbage (Brassica rapa L. ssp. pekinensis cv. CR-Baechu) seeds were germinated on perlite supplied with de-ionized water for 2 weeks. Uniformly grown seedlings (2nd - 3rd leaf stage, 30 - 35 plants) were transplanted into aerated 20 L hydroponic containers containing 1/2-strength Hoagland solution and grown for an additional 2 weeks prior to mineral treatment. Plants grew with permanent aeration at 25 ± 3°C during the day and 15 ± 3°C at night. Photosynthetic photon flux density (PPFD) at mid-day was 800 - 1,200 µmol m-2 s-1. The nutrient solution was replaced every 3 day. Nutrient solution (Control) was made up as follows: 2.5 mM Ca(NO3)2, 2.5 mM KNO3, 1 mM MgSO4, 0.25 mM KH2PO4, 0.75 mM Fe-EDTA, 0.5mM NH4NO3, 2 µMH3BO3, 0.2 µM MnCl2, 0.19 µM ZnSO4, 0.01 µM CuSO4 and 0.03 µM H2MoO4. To generate individual micronutrient-deficient conditions, the concentration of 6 elements (Fe, Cu, Mn, Zn, B, and Mo) was adjusted to 1/10-strength of control solution.
Cabbage plants displaying similar growth (5th - 6th leaf stage) within each treatment group were harvested between 10:00 and 12:00 to minimize any diurnal effects on metabolite levels at 15th day after the onset of treatment. After harvest, the shoots and roots were rinsed briefly in deionized water, immediately frozen in liquid nitrogen and stored at -80°C prior to metabolite analysis or oven-dried at 80°C for 48 h prior to mineral nutrient analysis.
Micronutrient Concentrations The powdered shoots and roots (100 mg, DW) were mixed with 5 mL of 368 mmol-1 L salicylic acid in 84.7% sulfuric acid (H2SO4, v/v) for 24 h and wet-digested at 300°C for 6 h, followed by the addition of several drops of hydrogen peroxide (H2O2). The extract was transferred to a 100 mL volumetric flask and diluted to 100 mL with deionized water for the mineral assays. Nitrogen concentration was determined using an automatic flow injection analyzer (Bran + Lube, Germany). Phosphorus concentration was measured using the molybdate-blue colorimetry method using a UV spectrophotometer (UV-2450, Shimadzu, Japan). The cations including K, Ca, Mg, Fe, Cu, Mn and Zn, were measured using an ICP-OES equipment (INTEGRA XMP, GBC, Australia) according to the manual.
Extraction and Analysis of Polar Metabolites Polar metabolites were extracted as described previously (Kim et al., 2016). The metabolites were extracted from powdered tissue (100 mg) by adding 1 mL of 2.5:1:1 (v/v/v) methanol: water: chloroform. Ribitol (60 µL, 0.2 mg/mL) was used as an internal standard (IS). Extraction was performed at 37°C at a mixing frequency of 1200 rpm for 30 min using a Thermomixer Compact (Eppendorf AG, Germany). The extracts were centrifuged at 16,000 × g for 3 min. The polar phase (0.8 mL) mixed with 0.4 mL water was centrifuged at 16,000 × g for 3 min. The methanol/water phase was dried in a centrifugal concentrator (CC-105, TOMY, Tokyo, Japan) for 2 h, followed by a freeze dryer for 16 h. The MO-derivatization was performed by adding 80 µL of methoxyamine hydrochloride (20 mg/mL) in pyridine and shaking at 30°C for 90 min. The TMS-esterification was performed by adding 80 µL of MSTFA, followed by incubation at 37°C for 30 min. The GC-TOFMS was performed using an Agilent 7890A gas chromatograph (Agilent, Atlanta, GA, USA) coupled to a Pegasus HT-TOF mass spectrometer (LECO, St. Joseph, MI). Each derivatized sample (1 µL) was separated on a 30-cm × 0.25-mm I.D. fused-silica capillary column coated with 0.25-µm CP-SIL 8 CB low bleed (Varian Inc., Palo Alto, CA, USA). The split ratio was set to 1:25. The injector temperature was 230°C, and a flow rate of helium gas through the column was fixed with 1.0 mL min-1. The temperature was set up as follows: initial of 80°C for 2 min, followed by an increase to 320°C at 15°C min-1 and a 10 min hold at 320°C. The transfer line temperature and ion-source temperature were 250 and 200°C, respectively. The scanned mass range was 85–600 m/z, and the detector voltage was set to 1700 V. The ChromaTOF software was used to support peak findings prior to quantitative analysis and for automated deconvolution of the reference mass spectra. The NIST and in-house libraries for standard chemicals were utilized for compound identification. The calculations used to quantify the concentrations of all analytes were based on the peak area ratios for each compound relative to the peak area of the IS.
Statistical Analysis Statistical analysis was performed using SAS software (version 9.2). Data were subjected to one-way ANOVA. If the ANOVA yielded a significant F value (p < 0.05), the differences among treatments were compared using Tukey’s range test. The relative quantification data acquired from GC-TOFMS were subjected to PCA (SIMCA-P version 13.0; Umetrics, Umeå, Sweden) to evaluate the relationships in terms of similarity or dissimilarity between groups of multivariate data (Kim et al., 2017). The PCA output consisted of score plots for visualizing the contrast between different samples and loading plots to explain the cluster separation. The data file was scaled with unit variance scaling before all variables were subjected to PCA. Pearson’s correlation analysis and t-tests were performed using the SAS 9.4 software package (SAS Institute, Cary, NC, USA). Correlation analysis among relative metabolite levels was performed using standardization pre-processing. HCA and heatmap visualization of the correlation coefficient were performed using MultiExperiment Viewer software version 4.4.0 (http://www.tm4.org/mev/).
Results and Discussion
Plant Growth and Micronutrient Concentrations Fig. 1 shows the growth rates of cabbage plants grown for 15 days in the medium which the concentration of each micronutrient was adjusted to 1/10 strength of Hoagland solution (See the Materials and Method for the detail). The growth inhibition was only observed in -B. Compared to the control (6.69 g/plant, DW), the relative growth rate was highest under -Fe conditions (99.9%, 6.68 g), followed by -Cu (99.5, 6.66 g), -Mn (97.6, 6.53 g), -Mo (93.3, 6.24 g) and -B (50.7, 3.39 g). Micronutrient concentrations (expressed as ug g-1, DW) in both shoots and roots were significantly affected by nutrient-deficient conditions (Table 1). The deficiency of all micronutrients represented the same pattern in concentrations; a decrease in Mn and Fe and an increase in Zn in the shoots, whereas a decrease in Mn and an increase in Fe and Zn in the roots. Cu concentration was hardly affected by the types of micronutrients. The correlation, expressed as a synergism and antagonism, between micronutrients has showed differently according to experimental conditions and it was well reviewed by Rietra et al. (2017). In the present study, it was observed that the deficiency of any micronutrient extremely restricted an uptake of Mn whereas enhanced an absorption of Zn, and this tendency commonly took place in both tissues. In addition, the deficiency of all micronutrients strongly restricted the translocation of Fe from roots to shoots, which led to an excess accumulation in roots. A similar observation was made by Yu and Rengel (1999); the deficiency of Cu, Zn and Mn resulted in substantial increase in Fe concentration in lupin plant. The compensatory uptake between metal ions under micronutrient stress has also been reported (Del Río et al., 1978; Iturbe-Ormaetxe et al., 1995). From the results, the deficiency of micronutrients seems to lead to an abundance in plants and this is considered to regulate redox status and ionic balance in cellular levels. However, the further study is required to better understand the nutrient-nutrient interaction as follows; 1) why the limited mobility of Fe from the roots and shoots commonly happens in all micronutrients-deficient conditions, and 2) why the deficiency of micronutrients leads to a substantial accumulation of Zn in both tissues.
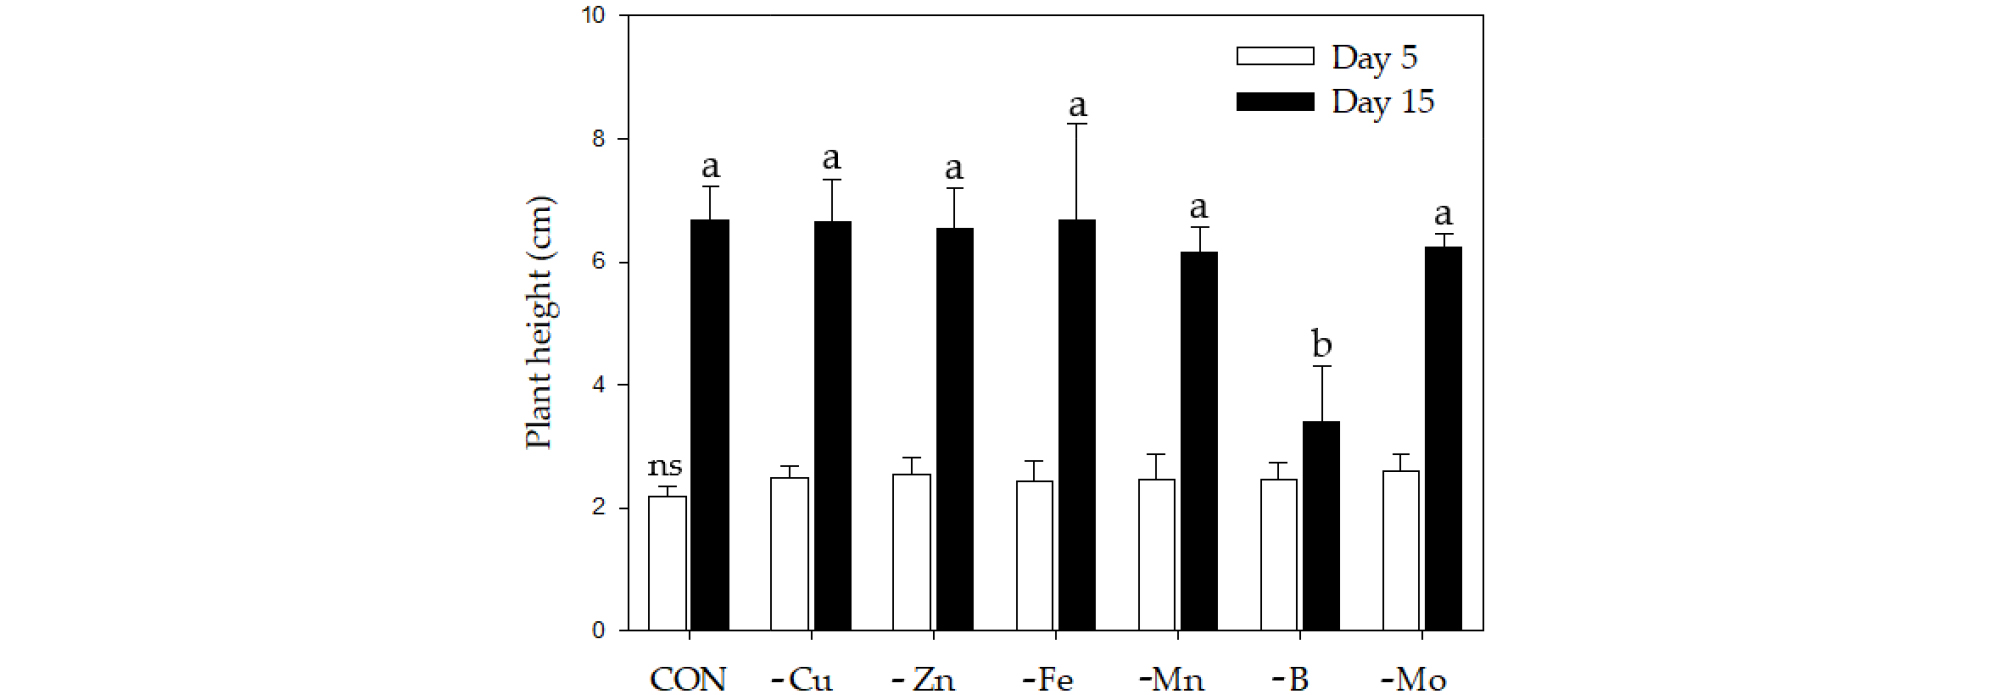
Table 1.
Micronutrient concentrations in the shoots and roots of cabbage plants subjected to various types of micronutrient-deficient conditions for 15 days.
Metabolic Responses to Micronutrient Deficiency A total of targeted 36 metabolites using GC-TOFMS were analyzed from the shoots and roots of cabbage plants supplied with limited micronutrients (1/10 strength of Hoagland solution). An examination of these metabolite profiles revealed a profound effect of micronutrients on the levels of dominant primary metabolites. The clustering of metabolites in the shoots and roots was studied using PCA (Fig. 2). In the shoots (Fig. 2a), -Zn and -B were separated from CON, -Cu, -Fe, -Mn and -Mo by PC 1. The PC 1 and 2 explained 48.8 and 21.4 % of the variability, respectively. In the roots (Fig. 2b), CON, -Fe, -Mn and -B were separated from -Cu, -Zn and -Mo by PC 1. The PC 1 and 2 explained 38.3 and 24.4% of the variability, respectively. The separation between clusters was associated with those metabolites with a large contribution (X-weight) to PC 1 (Fig. 3). In the shoots (Fig. 3a), identified metabolites with high positive X-weights were amino acids and organic acids, whereas those with large negative X-weight carbohydrates. On the other hand, high positive X-weights in the roots (Fig. 3b) only revealed some organic acids (phosphoric acid, quinic acid, pyruvic acid and shikimic acid) and urea, and most of identified metabolites represented high negative X-weights. We also performed HCA (Fig. 4) with identified metabolites from the shoots and roots, and it was divided into two (shoots, Fig. 4a) and four (roots, Fig. 4b) major clusters. Cluster I in the shoots included a majority of amino acids, and carbohydrates and some of organic acids was localized in Cluster II. The HCA in the roots divided into 4 cluster groups; a coexistence of amino acids and organic acids from Cluster I to III, and carbohydrates in Cluster IV.
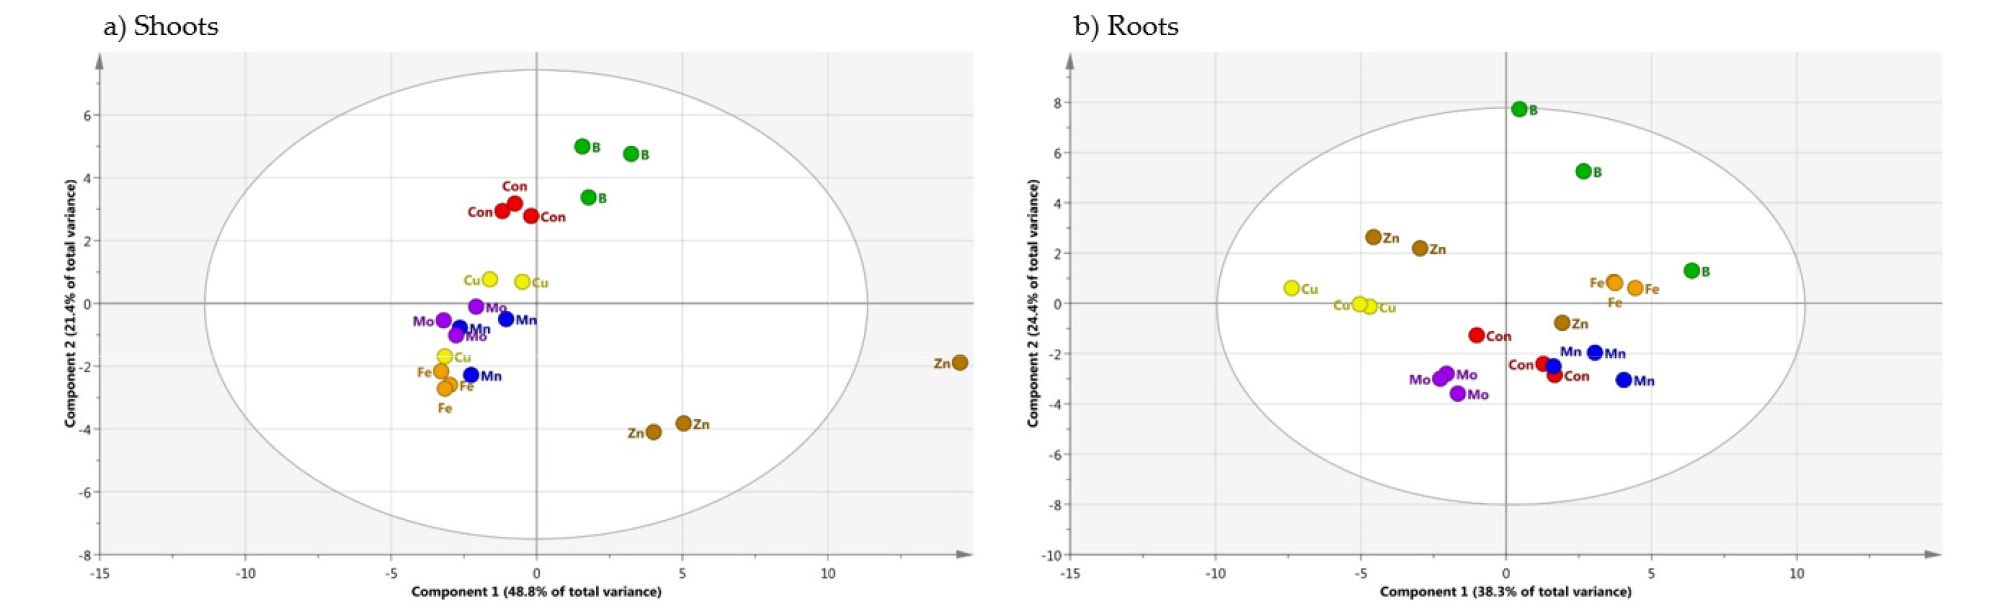
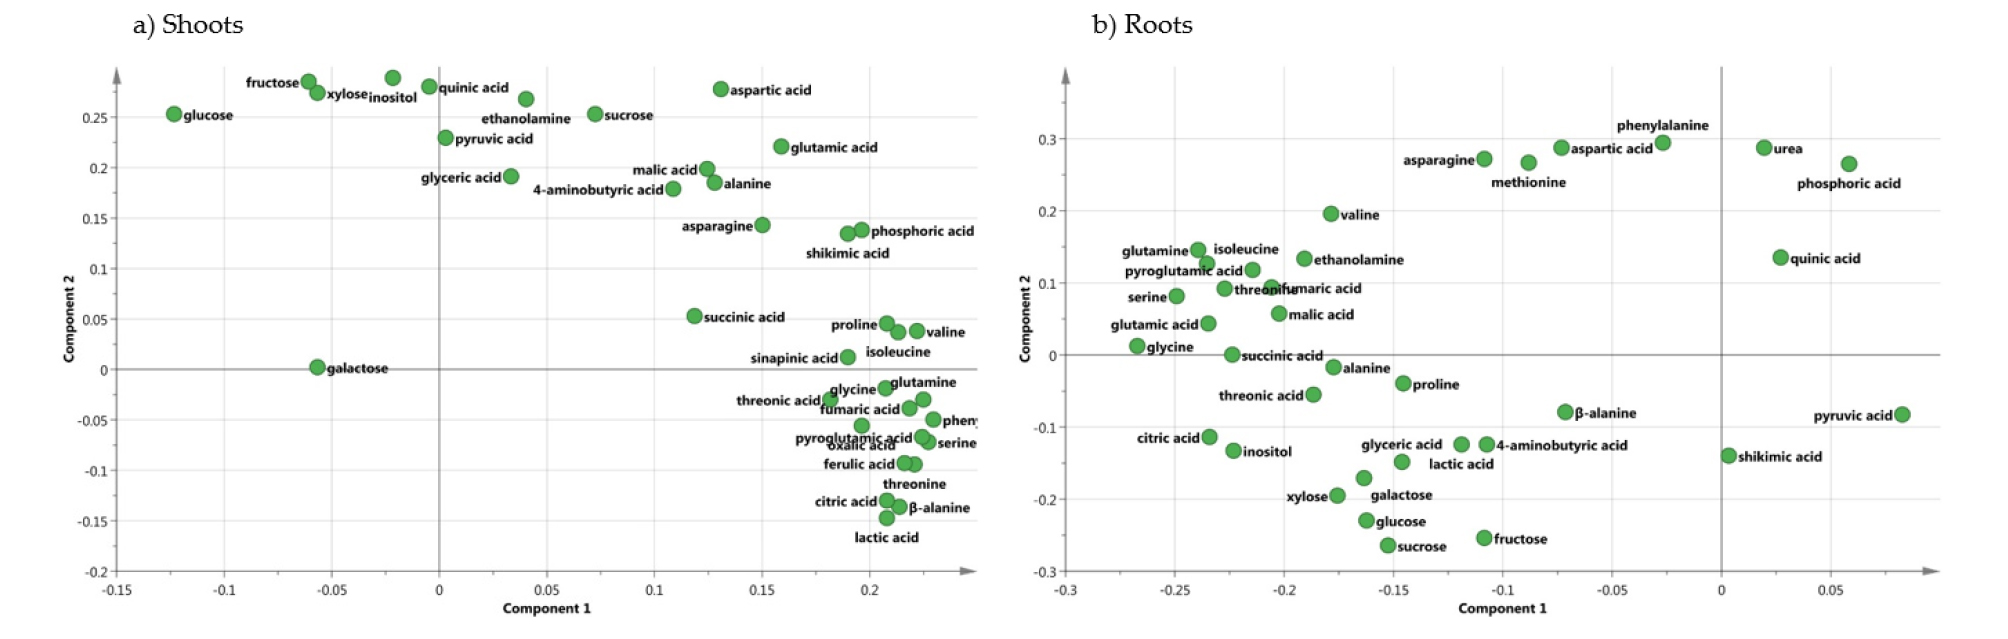
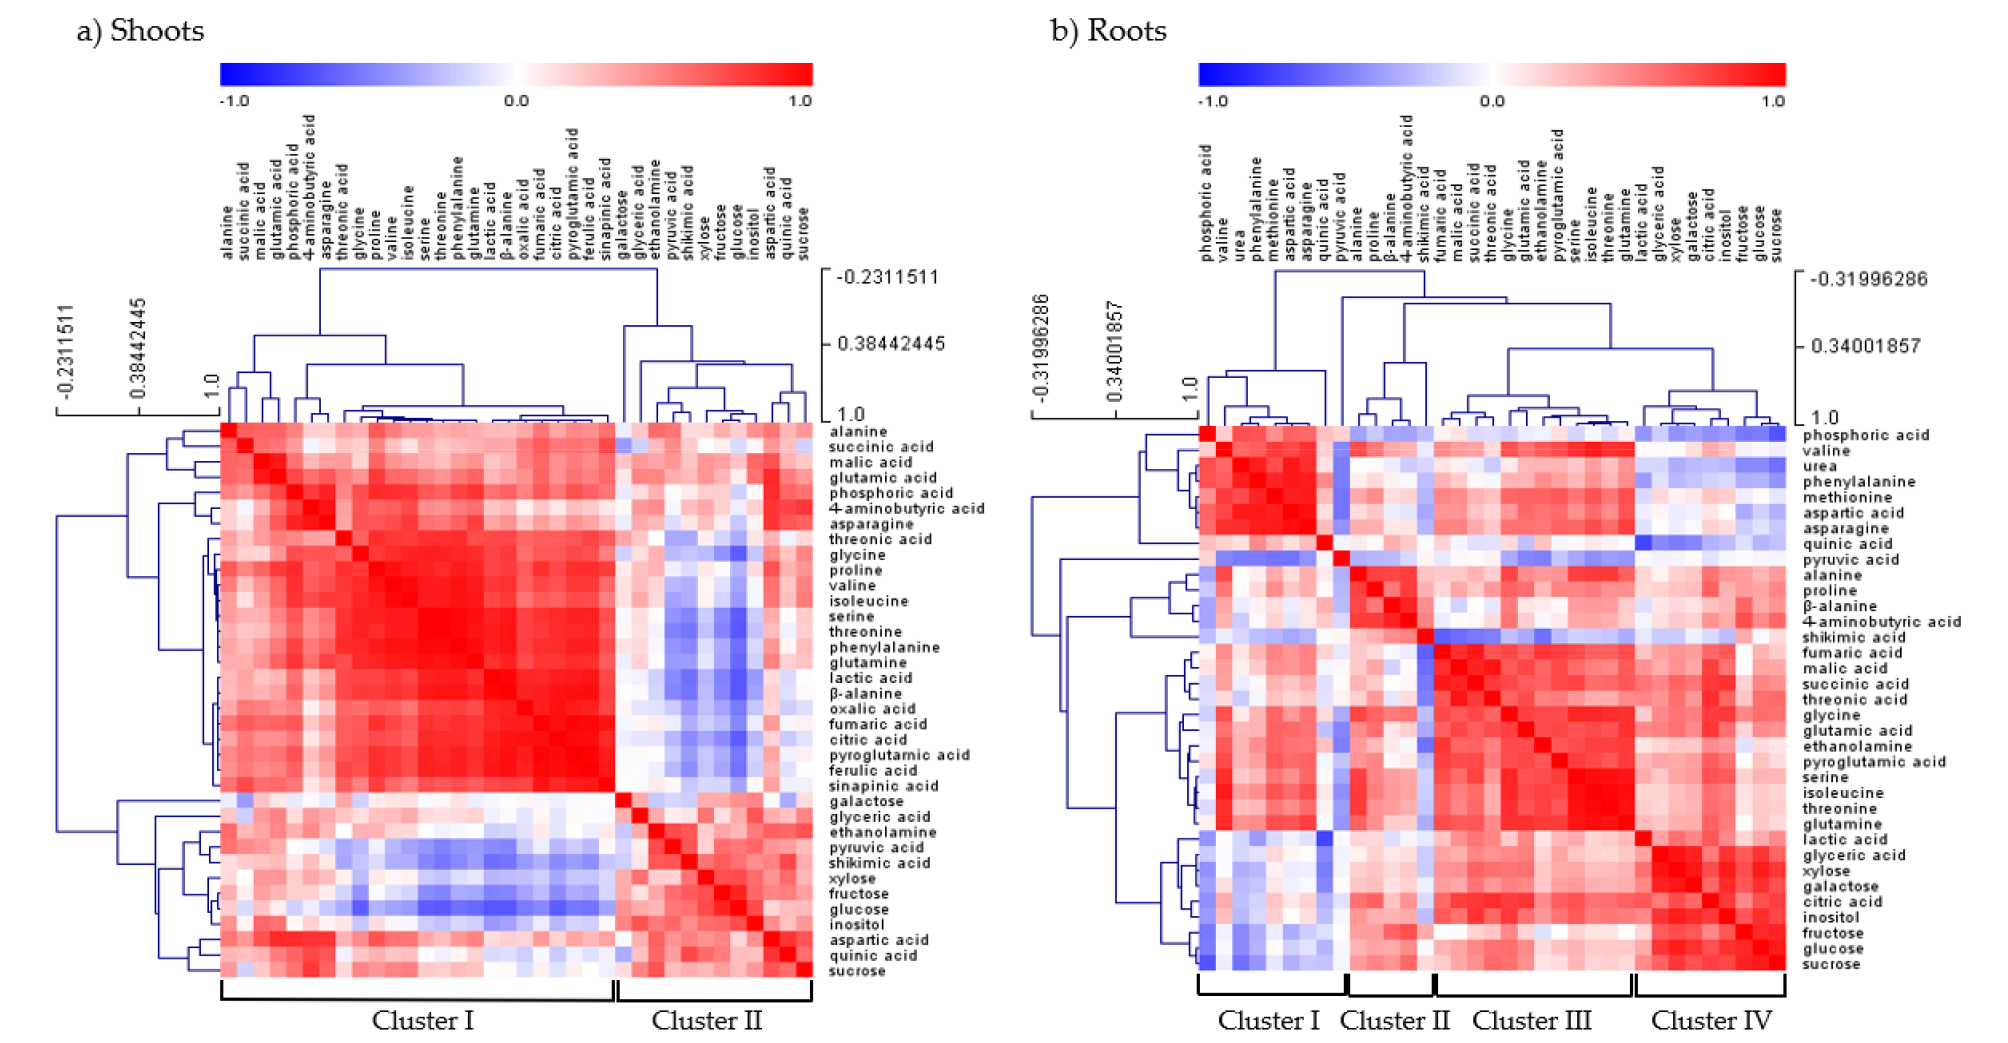
Fig. 4.
Correlation matrix and cluster analysis of polar metabolites from the shoots and roots of cabbage plants exposed to micronutrient deficiency for 15 days. Each square in the heatmap indicates the Pearson’s correlation coefficient for a pair of compounds. The value of the coefficient is represented by the intensity of the color (blue or red), as indicated on the color scale. Hierarchical clusters are represented in the cluster tree.
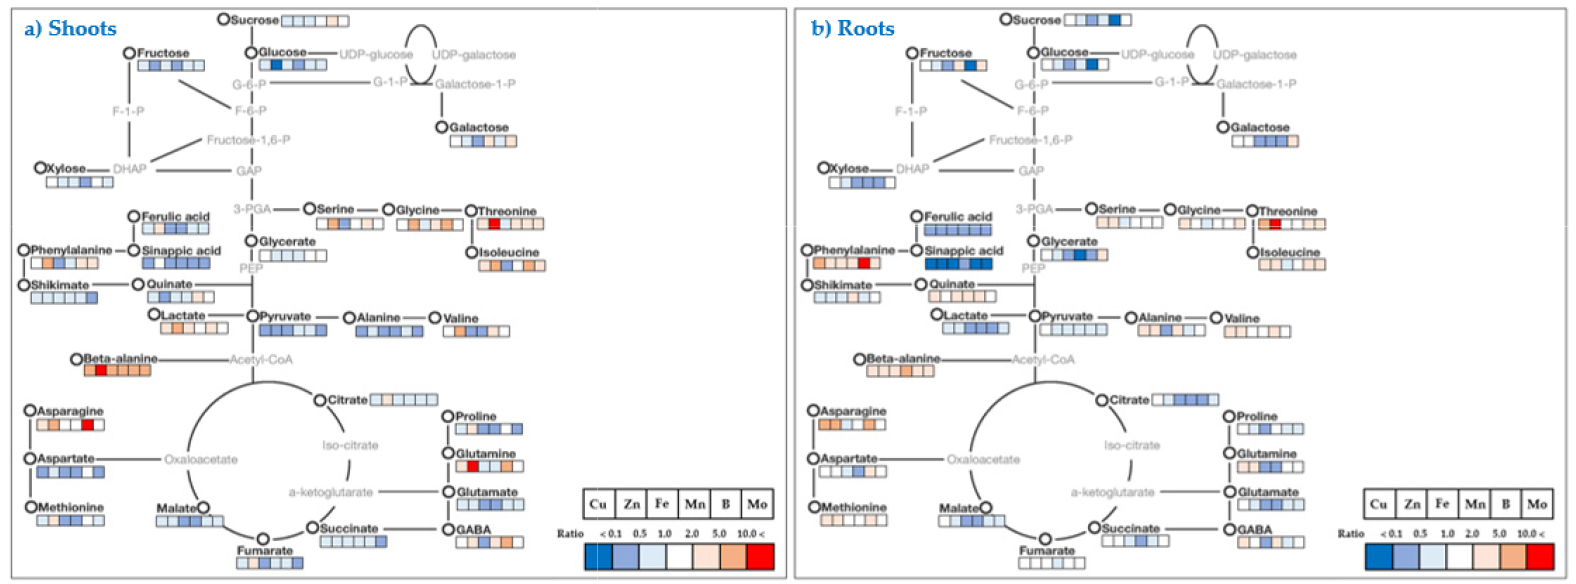
The relative fold changes of polar metabolites from the shoots and roots caused by micronutrient deficiency were illustrated in Fig. 5 (shoots) and 6 (roots). Overall, even though there were somewhat different in response to the type of micronutrients, the relative levels of carbohydrates, organic acids and others (secondary metabolism intermediates) represented a trend of a decrease, whereas amino acids showed an increase or decrease by the type micronutrients. A striking common effect of micronutrients deficiency on plant growth is a direct limitation of photosynthetic and respiratory metabolism due to the perturbation of electron transport chain reactions (Van Assche and Clijsters, 1990; Atwood et al., 2013), and metabolic changes by metal ion were similarly observed in excessive and deficient growth conditions (Jahangir et al., 2008). Here, an author describes some interesting results to be taken from the present study. The Fe deficiency resulted in negative abundance of most metabolites, except for beta-alanine, including secondary metabolism-intermediates in both shoots and roots. The levels of amino acids and phenolics, which have a metal chelator, were dependent upon metal ion concentrations (Xiong et al., 2006). The deficiency of Zn and B revealed to regulate similarly C-N metabolism; in terms of an accumulation of amino acids together with reduced levels of carbohydrates (monosaccharides). The disruption of C-N homeostasis is a common response to abiotic stresses (Nikiforova et al., 2005; Shulaev et al., 2008), and the similar C-N metabolic changes were also observed in rice plant by Zn deficiency (Rose et al., 2012) and in orange seedling by B deficiency (Dong et al., 2016). Moreover, B deficiency also strongly influenced on carbohydrate metabolism in terms of concentration and shoot-root communication. The relative levels of carbohydrates measured drastically reduced in both tissues except for sucrose in the shoots, and an accumulation of sucrose in the shoots was considered to restrict a sink capacity (lowered carbohydrate levels). B deficiency accumulates starch and nonstructural carbohydrates in the leaves of cotton (Zhao and Oosterhuis, 2002), tobacco (Camacho-Cristóbal et al., 2004) and sweet orange (Han et al., 2009), despite reduced photosynthesis. Taken together, we speculate the period and strength of B deficiency could determine carbohydrate metabolism; a restricted glycolysis in the shoots and blockage of photoassimilate (sucrose) from shoots to roots. Moreover, the substantial accumulation of phenylalanine, an amino acid which is directly involved in secondary metabolism, by micronutrient deficiency resulted in a significant decrease in secondary metabolism-intermediates, ferulic acid and sinapic acid, in both tissues, although it was more considerable in the shoots. Consequently, it could be considered that the reduction in secondary metabolism- intermediates due to the deficiency of micronutrients may downregulate pentose phosphate pathway (PPP) as suggested by Dong et al., (2016) or accumulate phenylalanine as represented here. Of amino acids measured in this study, the level of β-alanine, a non-proteinogenic amino acid, was strongly enhanced in all conditions of micronutrient deficiency; shoots (5.8 - 34.8-fold increase) and roots (2.0 - 6.9-fold increase). The highest fold increase was observed by Zn deficiency in the shoots and Mn deficiency in the roots, respectively. β-alanine in plants is synthesized from 4 biochemical pathways; 1) polyamines, 2) propionate, 3) uracil and 4) L-aspartic acid (reviewed by Parthasarathy et al., 2019), and has been reported to be mainly accumulated under abiotic stresses like low-oxygen, -light and -nitrogen (Miyashita et al., 2007). Meanwhile, there was no or little information about a significant accumulation of β-alanine by micronutrient deficiency. Consequently, an accumulation of β-alanine from our result is considered to be synthesized from polyamines or propionate pathway.
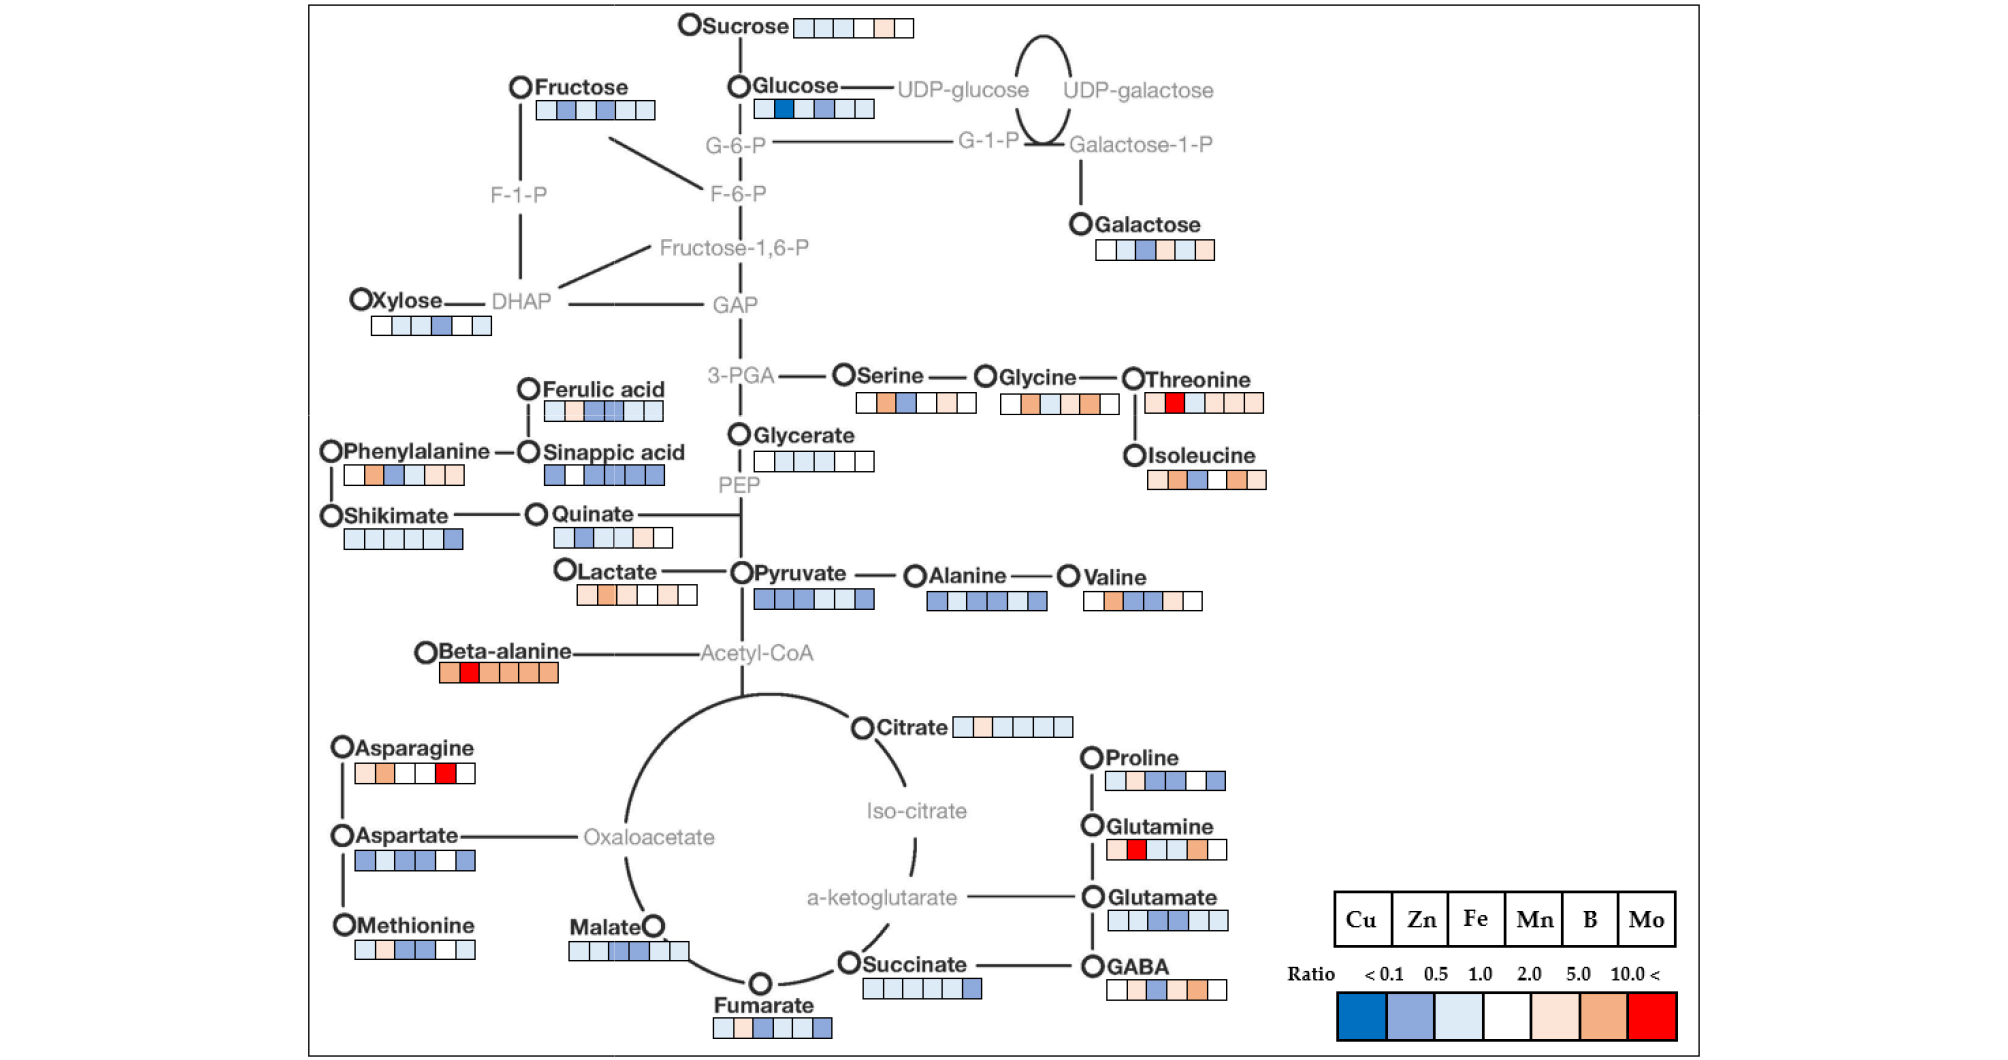
Fig. 5.
Mapping of targeted metabolite changes on known pathway for cabbage shoots. Cabbage plants were grown under individual micronutrient-deficiency conditions (1/10-strength of Hoagland solution) with the nutrient solution replaced every 3 d for 15 days. Data indicate the fold change compared to the control.
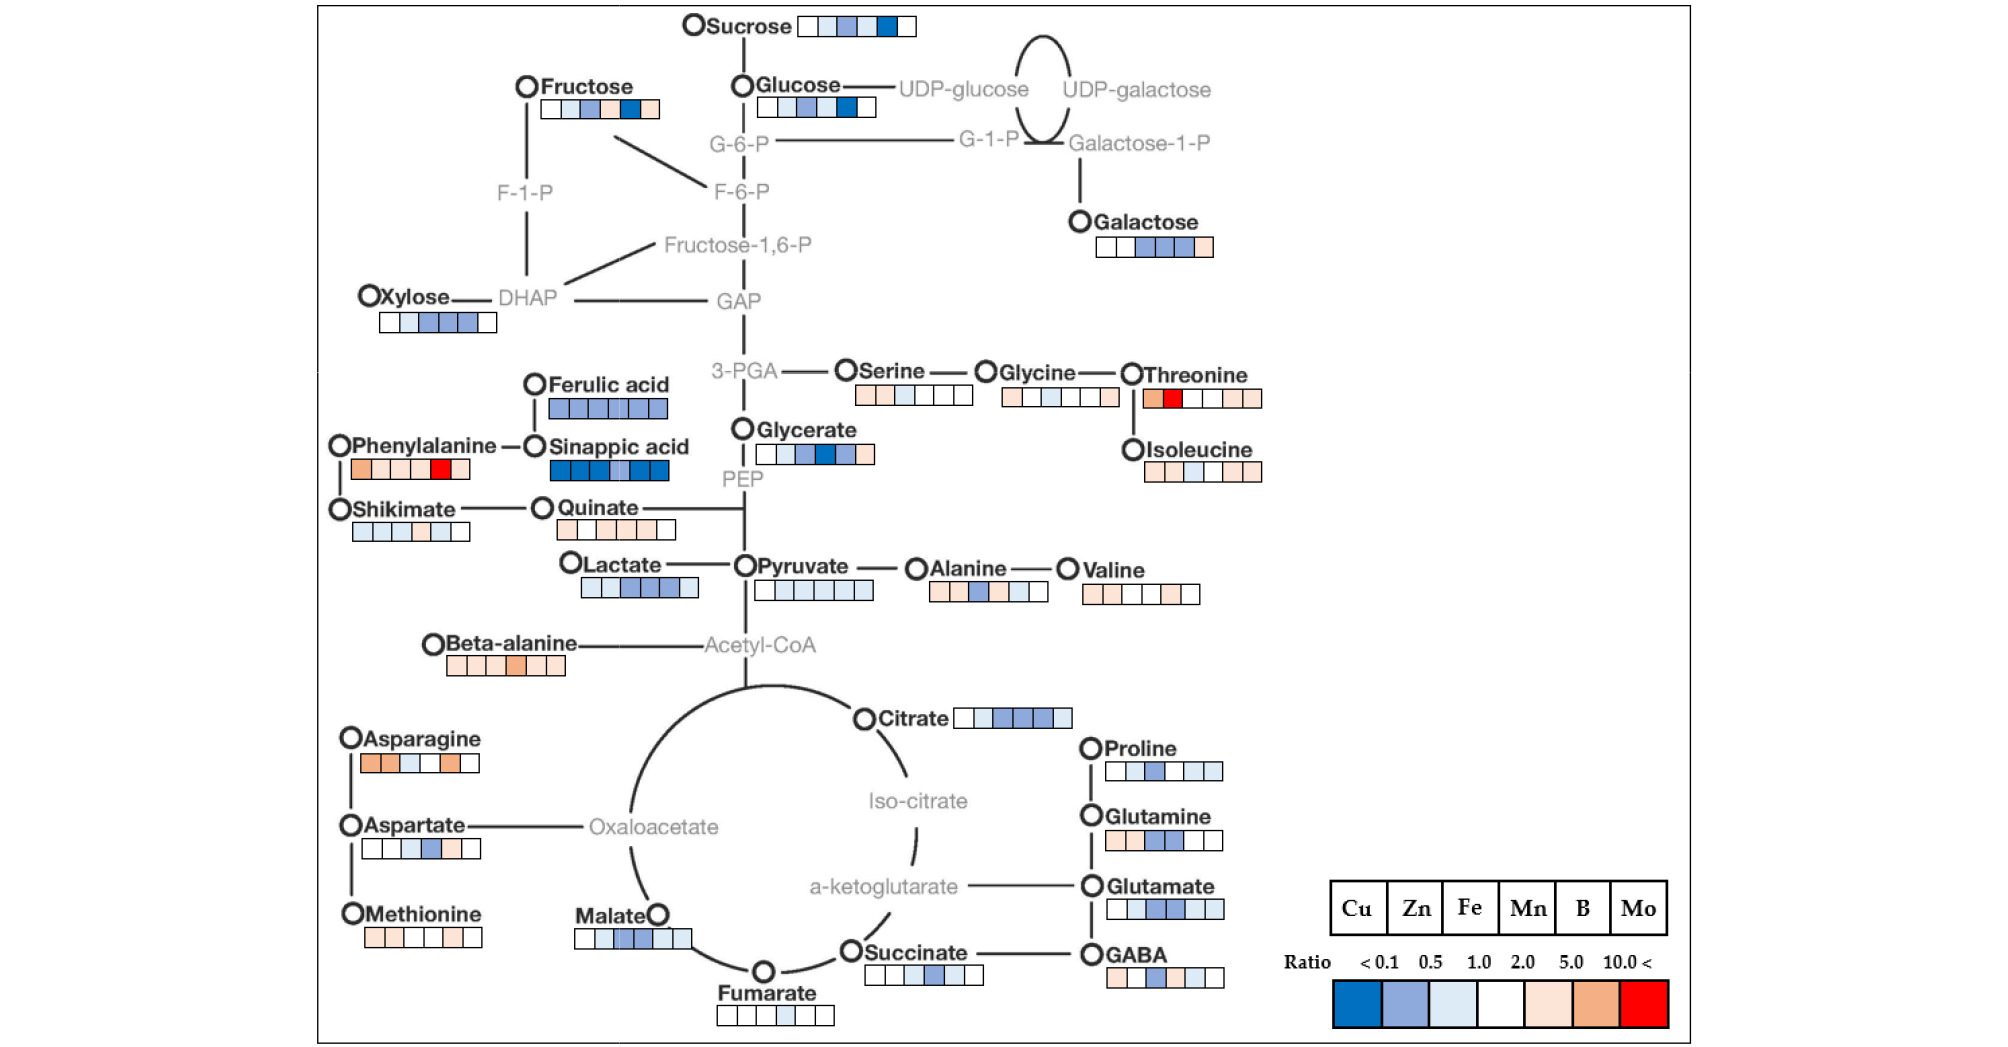
Fig. 6.
Mapping of targeted metabolite changes on known pathway for cabbage roots. Cabbage plants were grown under individual micronutrient-deficiency conditions (1/10-strength of Hoagland solution) with the nutrient solution replaced every 3 d for 15 days. Data indicate the fold change compared to the control.
Conclusion
The present study obviously represents that carbon and nitrogen metabolism is strongly affected by micronutrient deficiency in the shoots and roots of cabbage plants by employing a GC-TOFMS metabolite profiling approach although there is somewhat variable in an abundance according to the type of micronutrients. Overall, a majority of primary metabolites showed a decreasing trend by micronutrient-deficient growth conditions. A substantial accumulation of β-alanine and significant reduction of secondary metabolism-intermediates were found in the response to micronutrient deficiency, and these results suggest the requirement of further study. In addition, amino acid metabolism was similarly observed by Zn- and B-deficient conditions, which increased the amino acid concentrations in both tissues except glutamate. Finally, the findings from the present study provide new insights to better understand micronutrient-specific metabolic changes in cabbage plants.
